Since we began publishing an annual study of revenue sources for Morningstar’s single-country equity indexes in 2019, the trend has been toward global interconnectedness. Each year, most markets saw their share of domestic revenues fall and international revenues rise. The companies that comprise the indexes seemed to be globalizing.
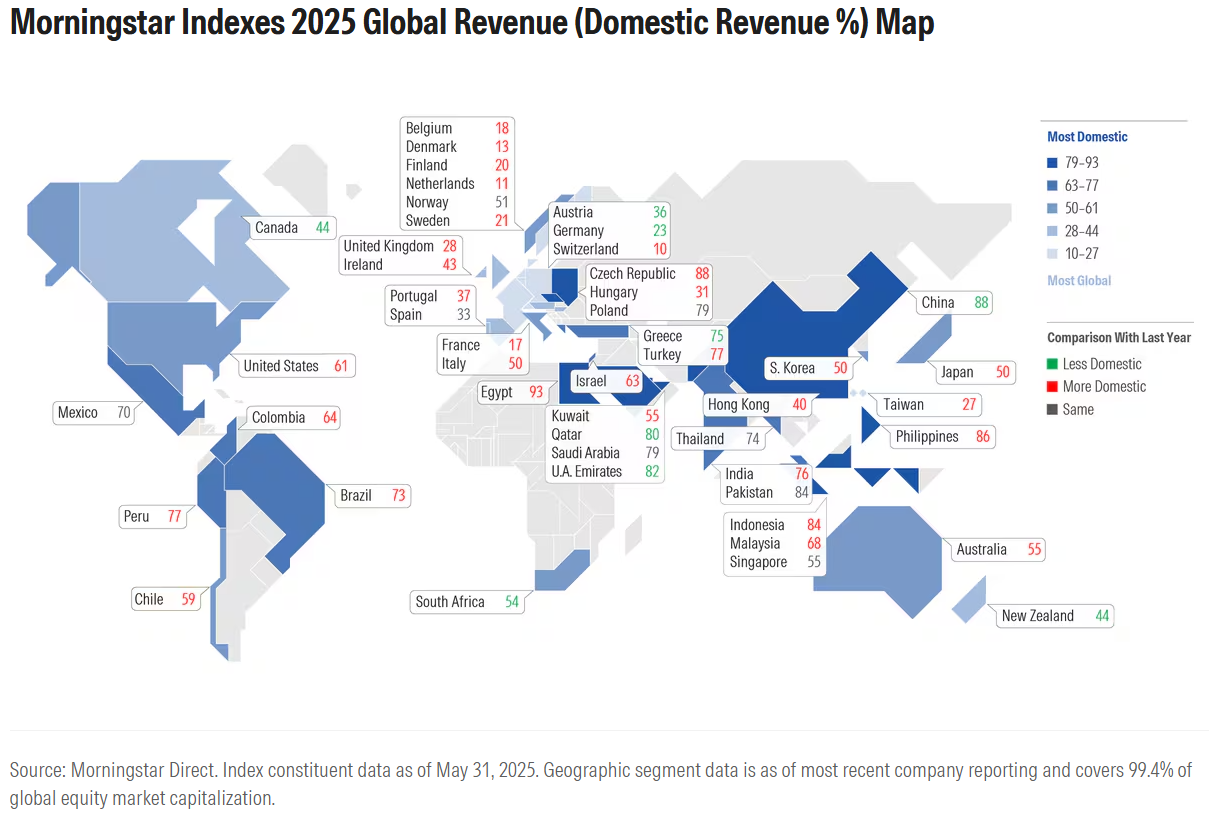
But this year saw a reversal. When Morningstar’s company-level geographic segment data is applied to Morningstar Global Markets Indexes, 31 of 48 countries sourced more revenues domestically compared with last year. For example, 61% of the Morningstar US Market Index‘s revenues come from the US, up from 60% last year. Japan and most of Europe also grew more domestic in their revenue orientation. The trend could have implications for investor portfolios.
It’s Because of Donald Trump, Right?
The most obvious explanation for the reversal is that President Trump is turning the US and other countries inward. As we all know, the president has an “America First” agenda. Tariffs and trade wars are seen by some as heralding an end to the era of globalization that began after the fall of the Berlin Wall and flourished under political parties of different stripes in the 1990s and 2000s. Out are free trade, global supply chains, and comparative advantage. In are protectionism, self-sufficiency, and national industrial policy.
Throwing a wrench in that explanation, however, is the issue of data timing. The above map uses constituent data for Morningstar Global Markets Indexes as of the end of May, but most of the revenue data for underlying companies predates Trump’s inauguration in January 2025. For example, Microsoft’s MSFT revenue by region data comes from its fiscal year that ended on June 30, 2024, and was disclosed via a 10-K filed on July 30, 2024. Apple’s AAPL fiscal year ends Sept. 30, and Nvidia’s NVDA on Jan. 31.
The same is true of international companies. Taiwan Semiconductor Manufacturing TSM, the largest company by market capitalization outside the US, ends its fiscal year on Dec. 31. Europe’s biggest company, SAP SAP, is on the same schedule.
That said, Trump’s first term (2017-20) could have had an impact. Tariffs put in place during those years, responded to by China, and continued by the Biden administration, may have affected corporate revenues. (For more on how Chinese manufacturing priorities changed as a result of Trump’s first term, I recommend our interview with Louis-Vincent Gave on Morningstar’s The Long View podcast.)
The pandemic surely played a part as well. Struggles to disseminate personal protective equipment raised questions about whether global supply chains were in the national interest. Military imperatives, amplified by Russia’s invasion of Ukraine, have also been invoked. What’s curious is that more markets globalized than turned inward when we conducted our studies from 2020 through 2024. Year after year, more markets increased the share of revenues coming from outside national borders.
It's About the Companies
As I wrote about last year, the economic sector is a key determinant of revenue orientation. Technology companies tend to be the most global in nature, with the basic materials and healthcare sectors also leaning international. Utilities, financial services, and real estate are most domestic. To name some familiar examples, the revenues of Microsoft and Nvidia are both roughly half domestic, half international, while JPMorgan Chase JPM is 78% domestic.
Could shifting sector weights be responsible for the deglobalization we’ve seen between last year and this year? The issue is that technology has actually increased its share of global equity market value. In May 2024, the technology sector represented 23.6% of the Morningstar Global Markets Index. In May 2025, technology’s share had grown to 24.5%.
If sector dynamics don’t explain revenue patterns, it must come down to companies. To invoke an old cliché, a stock market is a market of stocks. Looking at the three largest US companies—Microsoft, Nvidia, and Apple—all became more domestic between last year’s study and when we pulled the data after May 31, 2025. That explains a good chunk of the revenue reversal here in the US.
In other markets, domestically focused companies have grown in value, which then affects the country index’s revenue orientation. For example, in Brazil, Itau Unibanco ITUB, which is more than 80.0% domestic in its revenues, went from 7.4% of the Morningstar Brazil Index in May 2024 to 9.3% this year. In Japan, Toyota Motor TM fell as a share of the Morningstar Japan Index, while Mitsubishi UFJ Financial Group MUFJ rose. The former is a far more global business than the latter.
Why Does Geographic Revenue Data Matter to Investors?
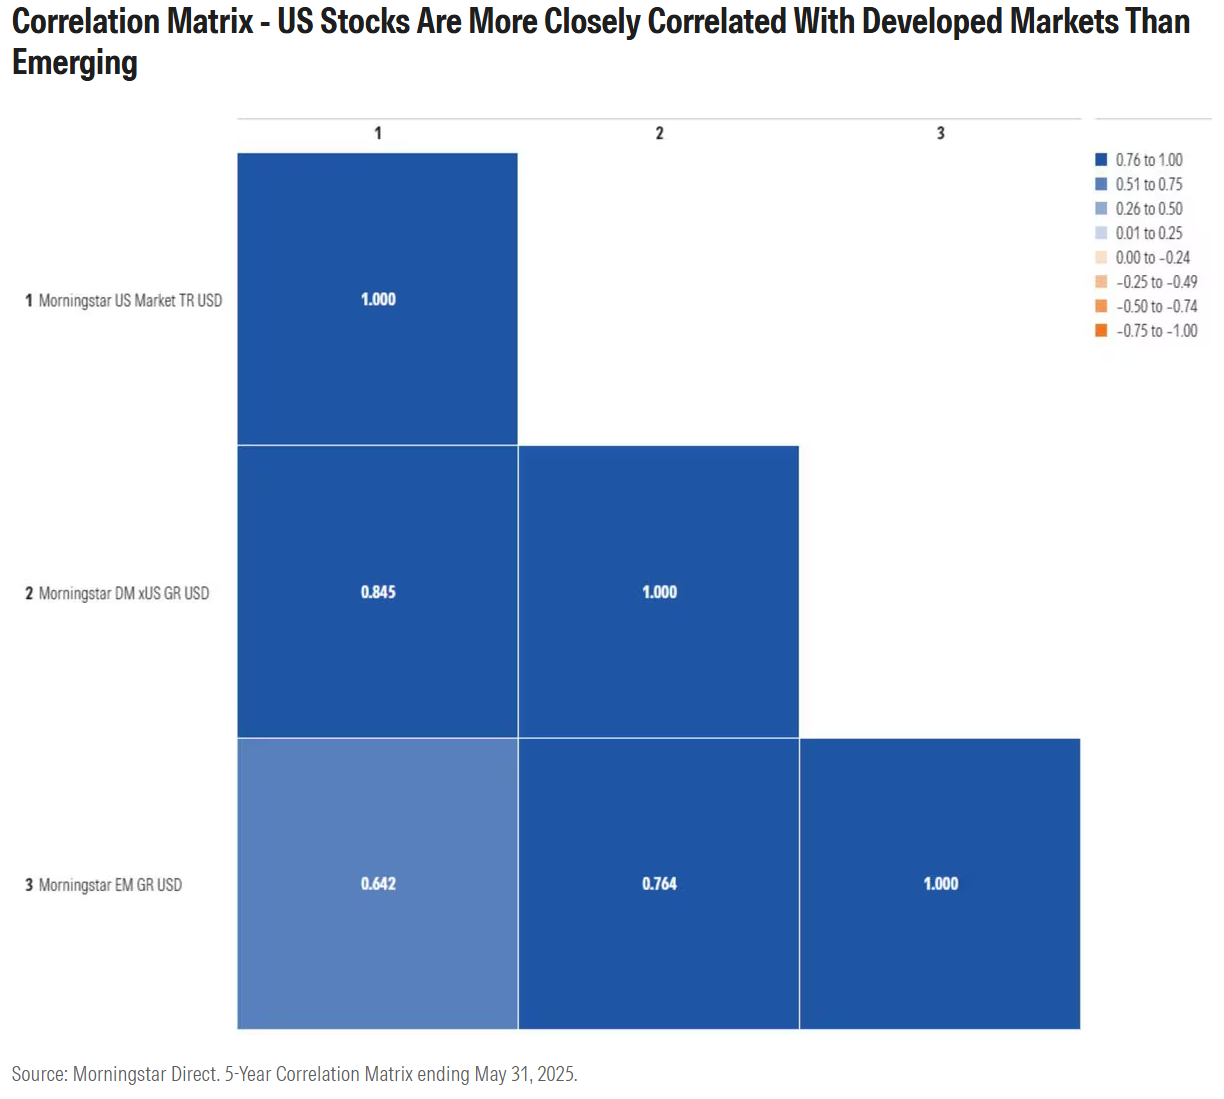
So, how should investors think about geographic revenue exposure in their portfolio? First, there’s the link between revenues and correlations. According to the Morningstar Diversification Landscape Report, equity markets in different regions have been increasingly moving in the same direction. That makes sense given the globalization of revenues. Global companies in different markets are often exposed to the same trends. For example, capital expenditures on artificial intelligence benefit the likes of Nvidia, Taiwan Semiconductor, and ASML ASML of the Netherlands alike. If markets become less globally connected, it could push correlations downward over time, thus improving the diversification benefits of global equity exposure.
It’s already the case that emerging markets, which tend to be less global in their revenues, are less correlated than developed markets. The relationship between an Indonesian bank and JPMorgan Chase is a lot weaker than those of global technology companies. The Morningstar US Market Index has a significantly higher correlation to the Morningstar Developed Markets ex-US Index than to the Morningstar Emerging Markets Index.
Revenue exposure is also important to keep in mind for investors making geographic bets. If you’re bullish on the Netherlands, for example, be aware that the performance of the Dutch equity market is less about the domestic economy than global businesses that derive 89% of their revenues outside national borders. It’s different when it comes to India, or even more dramatically, the Philippines or Indonesia. Although economic growth and stock market returns can diverge—as happened in China when the economy went up while the market went down—most emerging markets are domestically focused on their revenues. If this year’s revenue trends persist, national equity markets could become more national.
©2025 Morningstar. All Rights Reserved. The information, data, analyses and opinions contained herein (1) include the proprietary information of Morningstar, (2) may not be copied or redistributed, (3) do not constitute investment advice offered by Morningstar, (4) are provided solely for informational purposes and therefore are not an offer to buy or sell a security, and (5) are not warranted to be correct, complete or accurate. Morningstar has not given its consent to be deemed an "expert" under the federal Securities Act of 1933. Except as otherwise required by law, Morningstar is not responsible for any trading decisions, damages or other losses resulting from, or related to, this information, data, analyses or opinions or their use. References to specific securities or other investment options should not be considered an offer (as defined by the Securities and Exchange Act) to purchase or sell that specific investment. Past performance does not guarantee future results. Before making any investment decision, consider if the investment is suitable for you by referencing your own financial position, investment objectives, and risk profile. Always consult with your financial advisor before investing.
Indexes are unmanaged and not available for direct investment.
Morningstar indexes are created and maintained by Morningstar, Inc. Morningstar® is a registered trademark of Morningstar, Inc.