
The Takeaway
 While the so-called magnificent four stocks continued to push the growth indexes higher, in the US, value indexes' returns were more diversified with financial services delivering 22% of the total returns followed by even contributions from technology, healthcare, energy, and industrials.
 Valuation spreads between growth and value stocks, measured by P/E (trailing 12 months) have moderated over the past quarter. However, they remained historically high as of March 2024 for most segments, except for US mid-caps.
 Growth indexes saw an increase in exposures to the technology sector except for the US mid- and small-cap segments, which saw a decrease in technology and an increase in financial-services weight. Decreased exposure to real estate and the consumer defensive sector was observed across the board, while value indexes increased their exposure to energy and financial services.
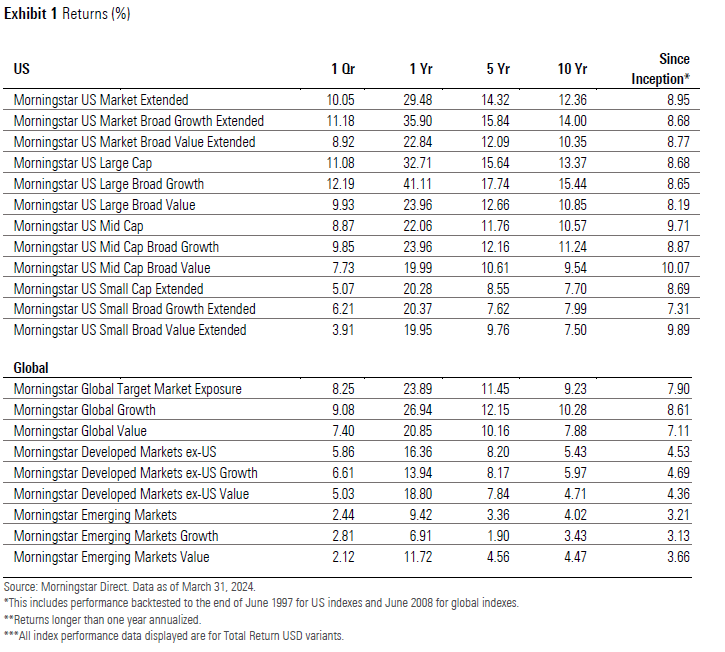
With continued expectations of a soft landing for the economy and rate cuts expected in March, the US markets sustained the optimism in the first quarter of 2024. In contrast to the fourth quarter of 2023, where the market rally was spread across large, mid, and small-caps, this time, the US large caps have outperformed their mid- and small-cap counterparts by 221 and 601 basis points, respectively.
Relative to its value counterpart, the Morningstar US Market Broad Growth Index's outperformance in the first quarter of 2024 was based primarily on the selection effects within sectors, particularly in the technology, healthcare, and industrials sectors. Nvidia continued to be investors' favorite bet on the AI play, contributing 37% toward the broad growth returns followed by Microsoft, Amazon, and Meta each contributing 13%, 12%, and 7%, respectively. Together, these four stocks account for 69% of the total index returns. Eli Lilly (positive 33% return) and General Electric (positive 37% return) further boosted the relative performance for the growth index, and the exclusion of Boeing (negative 26% return) shielded the index from losses. At the same time, Apple (negative 10% return) and Tesla (negative 29% return) proved to be the leading detractors for the growth index. While the return drivers for growth style were concentrated in a few pockets, value indexes' returns were more diversified, with financial services contributing 22% of the total returns followed by technology (18%), healthcare (13%), energy (12%), and industrials (11%).
©2024 Morningstar. All Rights Reserved. The information, data, analyses and opinions contained herein (1) include the proprietary information of Morningstar, (2) may not be copied or redistributed, (3) do not constitute investment advice offered by Morningstar, (4) are provided solely for informational purposes and therefore are not an offer to buy or sell a security, and (5) are not warranted to be correct, complete or accurate. Morningstar has not given its consent to be deemed an "expert" under the federal Securities Act of 1933. Except as otherwise required by law, Morningstar is not responsible for any trading decisions, damages or other losses resulting from, or related to, this information, data, analyses or opinions or their use. References to specific securities or other investment options should not be considered an offer (as defined by the Securities and Exchange Act) to purchase or sell that specific investment. Past performance does not guarantee future results. Before making any investment decision, consider if the investment is suitable for you by referencing your own financial position, investment objectives, and risk profile. Always consult with your financial advisor before investing.
Indexes are unmanaged and not available for direct investment.
Morningstar indexes are created and maintained by Morningstar, Inc. Morningstar® is a registered trademark of Morningstar, Inc.