
Do stocks outperform cash? The chart below based on 100 years of US stock data from CRSP RDP appears to provide a definitive answer – Yes. A cap-weighted index of all securities delivers an annualized 10% return.
But what about the individual constituents of the index? How does an individual company perform through its entire history? Would your answer change?
This is the question recently explored by Morningstar Indexes experts Dan Lefkovitz and Alex Poukchanski with special guest Dr. Hank Bessembinder, professor and the Francis J. and Mary B. Labriola Endowed Chair in Competitive Business at Arizona State University, for a packed session at the recent Morningstar Investment Conference in Chicago.
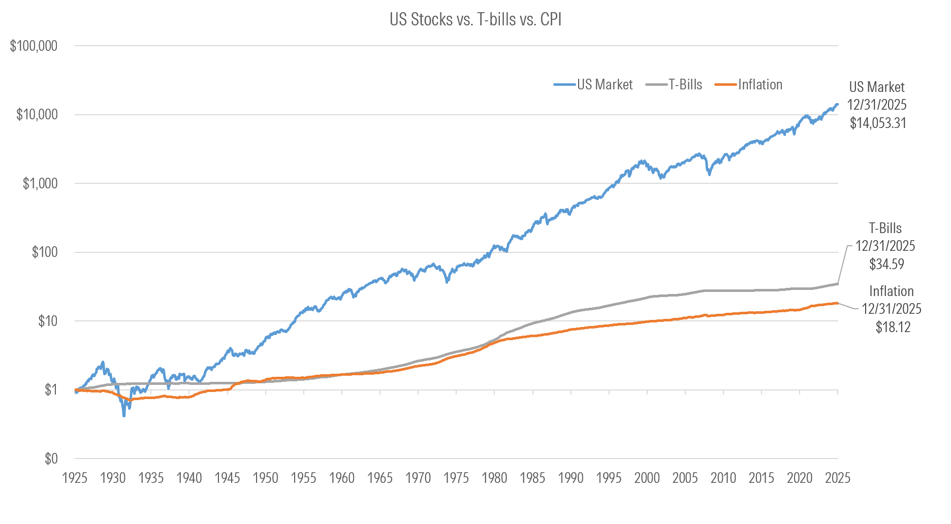
Source: CRSP RDP Data monthly returns; US Market is CRSP NYSE/NYSEMKT/Nasdaq/Arca Value Weighted Market Index; T-Bills returns are based on 90-day series return; Inflation is based on CPI.
Following are some highlights from the discussion Dan and Alex had with Hank around his research on 100 years of US equity market returns based on the CRSP US Stock Databases:
Hank, can you describe your research study? In 2018, I first published my study “Do Stocks Outperform Treasury Bills?” which examined US stock performance since 1925 drawing on the CRSP US Stock Database. My original study included 25,000 companies and, in 2025, I expanded the analysis to include nearly 30,000 companies.
You studied the stocks of 30,000 public companies over a century of market ups & downs. What were the results? The results were quite surprising actually. In a nutshell, the majority of stocks have performed quite poorly over the last century, with less than half showing a positive return and just four out of ten outperforming US Treasury bills.
Where did all the wealth creation in the US equity markets come from? Roughly half the wealth creation over the last 100 years has been driven by just 46 stocks ― out of 30,000! And the entire $91 trillion in net wealth creation over the last 100 years was generated by 1,082, or just 3.7%, of the stocks in the CRSP US Stock Database.
What are the implications of your study for optimal portfolio strategy? The results of the study support broad diversification AND support the selection of concentrated portfolios as the best strategy. It depends on your comparative strength.
So, what’s the punchline? Is this an argument for active or passive investing? Yes! It is really up to the investor to decide what approach makes sense. For most investors, it makes sense to “own the haystack” as John Bogle of Vanguard famously used to say, spreading your bets and owning the entire market. But if you consider yourself either smart or lucky, or both, you may want to rely on active stock selection or picking a successful fund manager. There is no single path.
Do you think these results may change with so many companies staying private much longer? It is true that the more recent public listings are coming from much larger fi/rms. What does this potentially mean for investors? The fact that companies are increasingly coming to market at a much larger – and mature – point in their lifecycle could increase the narrow nature of the wealth creation, but as an economist – and as investors, we need more transparent data on private companies to better understand that trend.
I’m still confused. As an investor, what should I take from this session? Every investor is different, of course, but one way to think about it is to focus on your comparative advantage. Do you consider yourself to have a unique skill that sets you apart – like a professional athlete – or do you think a broader percentage play is warranted? It’s probably best that no one ever tried to convince Warren Buffet about the benefits of diversification! A few people likely have a natural comparative advantage as stock pickers. If you are not the stock picker, an additional question is whether you can identify the successful managers easily to place your investment.
Thanks, Hank.