

Morningstar Indexes’ global revenue study shows many equity markets have become more internationally connected, led by the rise of AI companies.
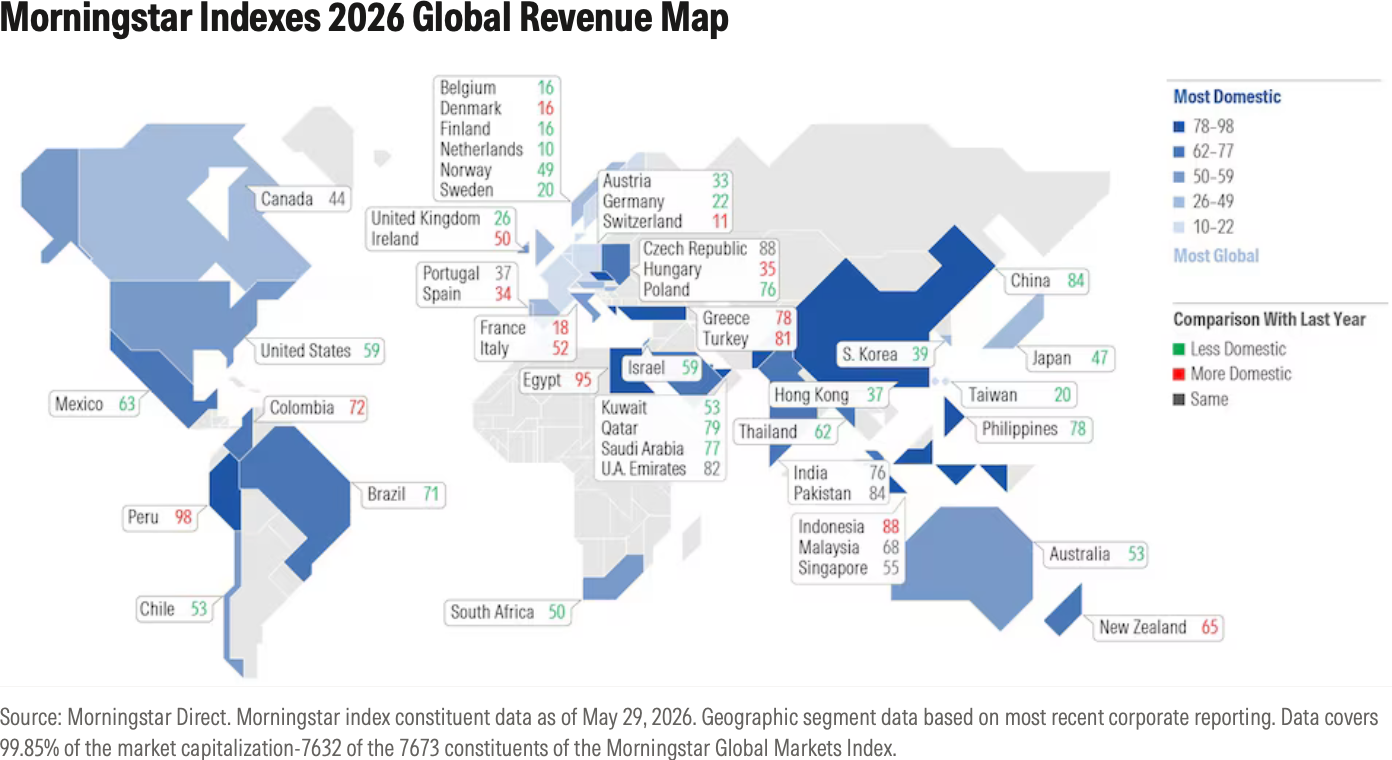
Just 59% of the US stock market’s revenues come from the US, down from 61% at this time last year. South Korea, Taiwan, China, Japan, and the Netherlands also became more international in their revenue sources since our 2025 global revenue study.
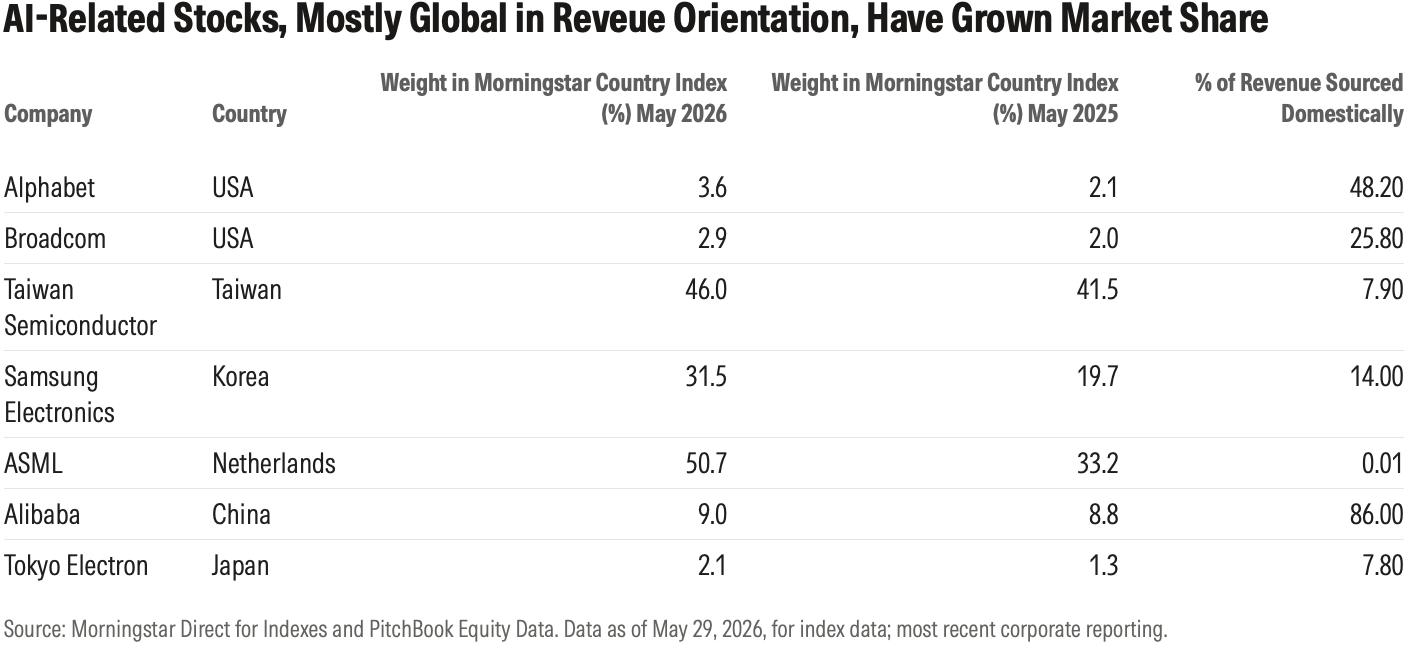
What do these markets have in common? They are all home to important artificial intelligence stocks. As companies like Broadcom AVGO, Samsung Electronics 005930, Taiwan Semiconductor Manufacturing TSM, Alibaba Group BABA, Tokyo Electron 8035, and ASML Holding ASML have grown in market value, they have also given their local markets a more global orientation.
AI is a key factor, though not the only one, in many national stock markets becoming more globally interconnected. When Morningstar’s company-level geographic segment data is applied to Morningstar Global Markets Indexes, the majority of countries derive a larger share of revenue from abroad compared with last year. Only 14 markets became more domestic in their revenue orientation compared with last year. Revenue sources are an important consideration for investors as they think about portfolio allocations.
AI Drives Markets’ Revenue Globalization
AI has reshaped stock markets across the globe. Trillions are being spent building out AI infrastructure, benefiting providers of semiconductors, memory, and data centers. Earnings and stock prices for AI beneficiaries have soared. Many AI stocks across the globe have even joined a Triple Digit Club, meaning they have risen by more than 100% in 2026 alone.
As AI stocks have dominated, they have tended to boost the share of international revenues of their home markets. Broadcom, for example, derives only one-fourth of its revenue from the US. The chipmaker was one of the 10 largest US companies as of May 2026. AI has also given key Asian markets a more global orientation.
AI Isn’t the Only Force for Globalization. There’s Also Natural Resources.
AI isn’t the only factor pushing countries in the direction of more global revenue streams. Many natural resources-driven markets have also globalized. AI, clean energy, and geopolitics have driven a global mining boom. Prices for gold and oil also rose between mid-2025 and mid-2026.
As a result, natural resources-driven markets, including Brazil, Chile, Australia, South Africa, and much of the Persian Gulf, have become more global in their revenue orientation compared with last year’s study. In Brazil, minerals exporter Vale VALE and oil company Petrobras PBR have grown their market share since last year. In Chile, lithium miner SQM SQM has risen in prominence. Australian miner BHP BHP and South Africa’s Gold Fields GFIOF have increased in relative market size since last year.
The UK is another market that has globalized, thanks in part to natural resources. Like most European countries, it sources the majority of its revenues internationally—26% as of this year’s study. Oil companies Shell SHEL and BP BP, as well as miners Rio Tinto RIO and Glencore GLEN, have all increased their market share over the past year.
What About Non-AI, Non-Natural Resources Markets?
As usual, the most domestically oriented markets tend to be emerging. Countries with large populations, including Egypt, Indonesia, Pakistan, Turkey, the Philippines, India, and Thailand, are all mostly domestic in their revenues. Few became less domestic since last year’s study. These markets have little exposure to AI or natural resources stocks. Though Indonesia is a resource-rich country, its stock market is dominated by banks and telecoms.
At the other end of the spectrum, the world’s most global markets are mostly European. Few have substantial AI or natural resources exposure, but many are dominated by multinationals. Regardless of their direction, markets like Germany, France, Switzerland, and Sweden remain deeply international. Multinationals like Siemens SIE, LVMH Moet Hennessy Louis Vuitton MC, Roche Holding ROP, and Volvo VOLV B derive substantial revenues from global sources, including the US.
How Can Investors Use Revenue Data?
Revenue sources are an important consideration for investors looking for diversification benefits in their global equities exposure. Stock markets reliant on AI are more correlated than those with no exposure. Over the past three years, AI-heavy markets Taiwan, Korea, and the Netherlands have been quite tightly tied to the US.
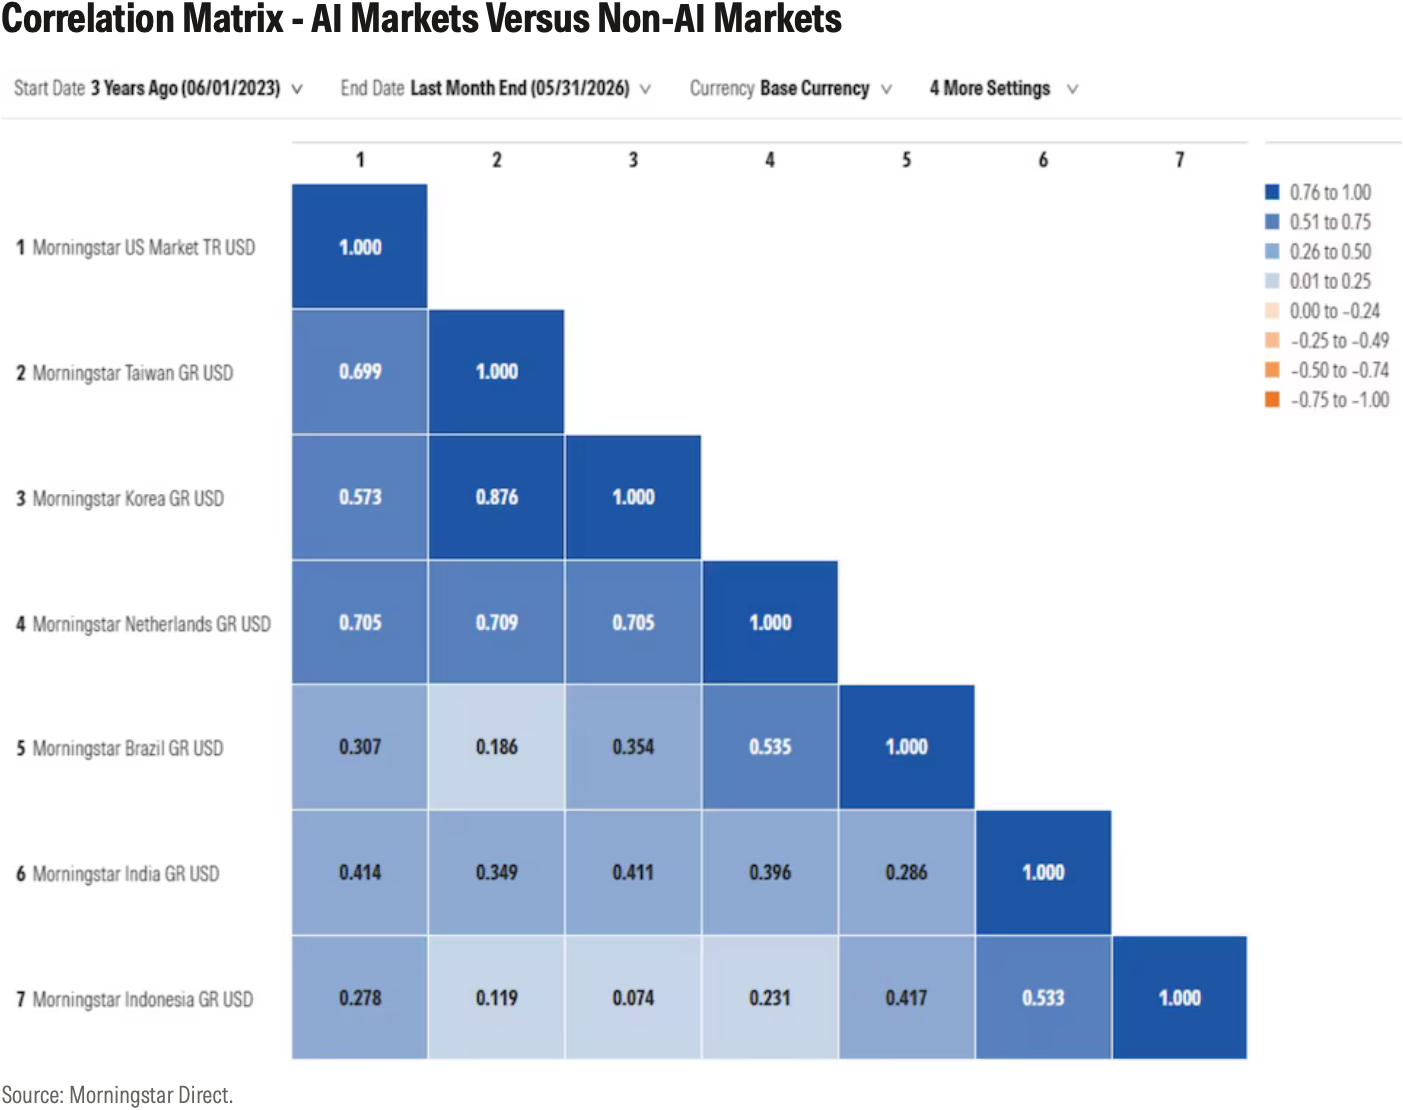
That’s not surprising: Companies like TSMC, SK Hynix, and ASML are dependent on the same factors as US mega-caps Nvidia and Broadcom. Less correlated to them all is Brazil, a natural resources-tied market, as well as Indonesia and India, which are mostly domestic in their revenues.
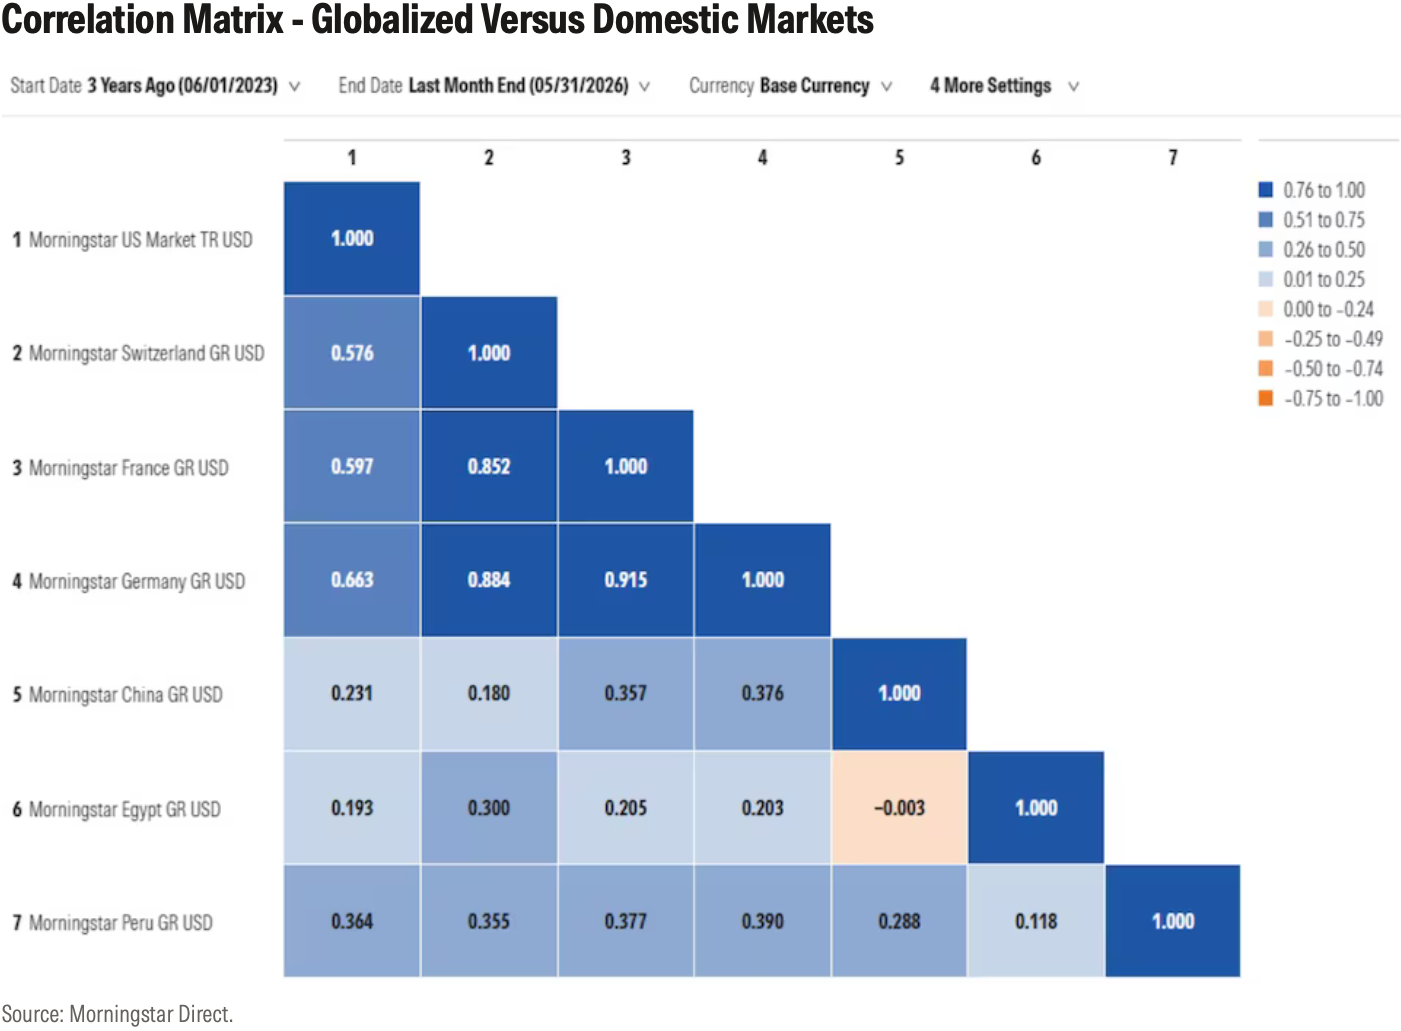
Domestically focused markets tend to be less correlated than globally connected ones. Markets like Switzerland, France, and Germany, which source the vast majority of their revenues abroad, are far more correlated to the US, and each other, than domestically focused markets like China, Egypt, and Peru.
Beyond diversification, revenue sources have other implications for portfolio allocation. An investor bullish on the Indonesian growth story can be reassured that 88% of Indonesian stock market revenues are sourced domestically. Korea, by contrast, is a bet on the global AI story. As investors consider their geographic exposure, it’s important to remember that some national equity markets are more national than others.
©2026 Morningstar. All Rights Reserved. The information, data, analyses and opinions contained herein (1) include the proprietary information of Morningstar, (2) may not be copied or redistributed, (3) do not constitute investment advice offered by Morningstar, (4) are provided solely for informational purposes and therefore are not an offer to buy or sell a security, and (5) are not warranted to be correct, complete or accurate. Morningstar has not given its consent to be deemed an "expert" under the federal Securities Act of 1933. Except as otherwise required by law, Morningstar is not responsible for any trading decisions, damages or other losses resulting from, or related to, this information, data, analyses or opinions or their use. References to specific securities or other investment options should not be considered an offer (as defined by the Securities and Exchange Act) to purchase or sell that specific investment. Past performance does not guarantee future results. Before making any investment decision, consider if the investment is suitable for you by referencing your own financial position, investment objectives, and risk profile. Always consult with your financial advisor before investing.
Indexes are unmanaged and not available for direct investment.
Morningstar indexes are created and maintained by Morningstar, Inc. Morningstar® is a registered trademark of Morningstar, Inc.