As an investment concept, “dispersion” measures the spread between returns. If Asset A has gained 50% and Investment B has gained 10%, their dispersion is greater than returns of 30% and 20%, respectively. It’s all about the distance separating winners and losers.
So, why look at the metric? “Dispersion contains valuable information about the nature of markets,” according to my colleague Ishaan Narula, a quantitative researcher who has studied the subject. “It can be used to guide the process of asset allocation,” he writes.
Given that last week I cautioned against relying too heavily on correlation data when assembling a portfolio, I thought I’d be constructive and highlight a complementary metric. What can dispersion data for the US stock market tell investors? And how can investors build more resilient portfolios as a result?
We’ve Entered a New, Higher-Dispersion Regime
Let’s start with historical dispersion data for US stocks. Narula looked at quarterly dispersion within the Morningstar US Market Index, which includes large-, mid-, and small-cap stocks. The graph below, going back to the early 2000s, shows that dispersion often hovers at a baseline level until punctuated by spikes, which often coincide with crises. Narula links higher dispersion to performance divergence between economic sectors.
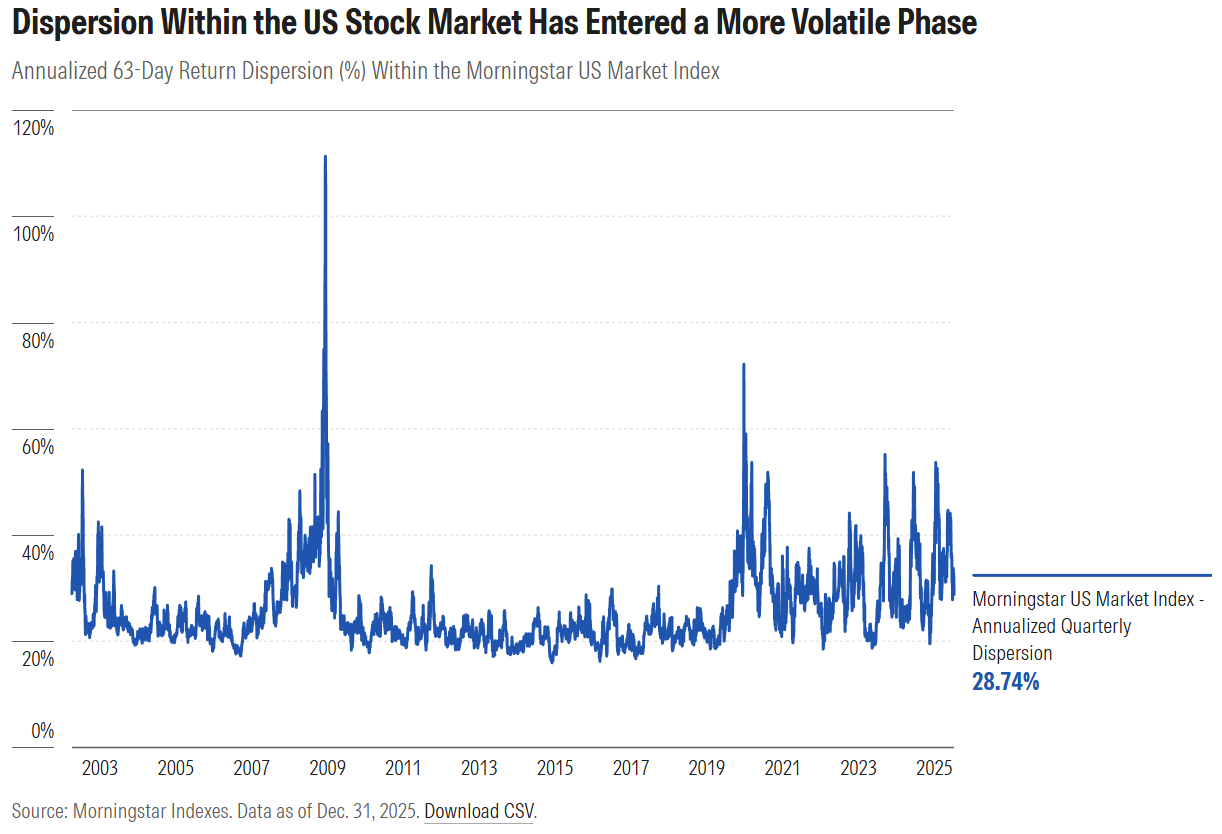
The first spike on the above graph came in 2002, amid a brutal 22% annual decline for the Morningstar US Market Index. The bursting of the dot-com bubble was still weighing on share prices, as were the aftereffects of the Sept. 11, 2001, terror attacks. In 2002, a series of accounting scandals, including those of Enron and Worldcom, undermined sentiment. Their collapse, as well as plummeting prices for technology stocks, contributed to high dispersion within the market.
After a period of stock market calm from 2003 to 2007, the global financial crisis triggered another spike in dispersion. The implosion of the US housing market and the fallout from subprime lending brought about the demise of mortgage lender Washington Mutual and a widespread banking crisis. Not only did financial-services stocks like Citigroup C and Bank of America BAC crater, but also cyclicals like Ford F and Dow Chemical DOW.
The coronavirus pandemic in 2020 ended a period of subdued dispersion levels that reached a low in May 2015, likely supported by rock-bottom interest rates. Societal lockdowns beginning in March 2020 caused a bifurcated market. Winners were the beneficiaries of the stay-at-home lifestyle: Zoom ZM, Peloton PTON, Netflix NFLX, Amazon.com AMZN, and technology behemoths like Microsoft MSFT. Losers were dubbed the BEACH stocks: booking, entertainment, airlines, cruises/casinos, and hotels/hospitality. Energy stocks suffered from falling oil prices.
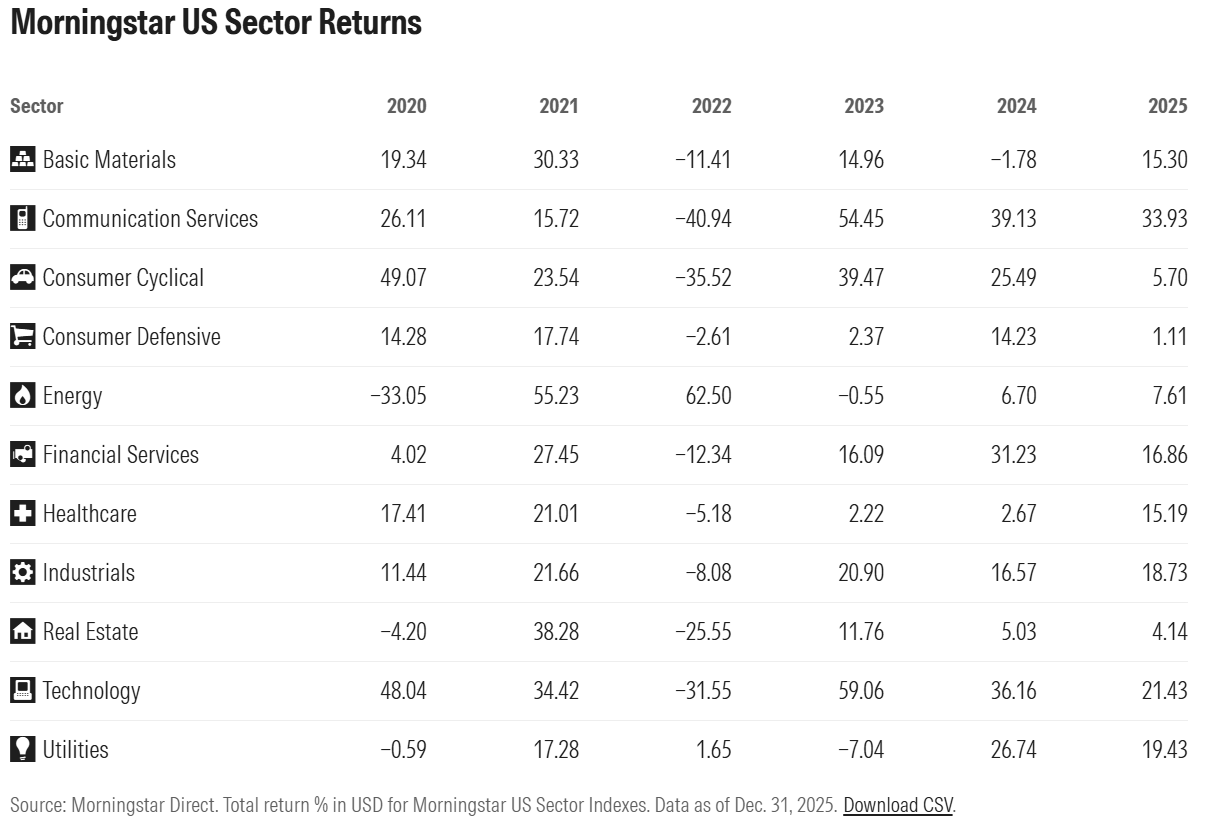
Narula’s data shows dispersion moving into a more volatile state since 2020. In 2021, the “reopening trade” saw energy stocks rebound dramatically. Returns for areas like consumer defensives and utilities were muted. In 2022, a period of high inflation and dramatic interest rate hikes prompted a crash in high-flying technology stocks and resilience in more defensive areas.
Since 2023, artificial intelligence-related companies have led the market. The technology and the communication services sector—dominated by Alphabet GOOGL and Meta Platforms META—have boomed. Utilities have benefited from AI-driven power demand, while consumer defensives and real estate have struggled.
What Should Investors Make of Dispersion Data?
Dispersion data is often tied to the active versus passive management debate. In theory, a higher dispersion environment is better for stock-pickers. When the spread between stock returns rises, so do the rewards for identifying winners. The corollary, of course, is that a high-dispersion environment ups the risk of missing out on winners.
In practice, active strategies have struggled to outperform index-tracking counterparts, even during recent periods of heightened dispersion. According to the most recent Morningstar US Active/Passive Barometer study, summarized here, active managers’ records of outperforming and surviving in the large-cap US equities categories have generally been poor, albeit better in the mid and small-cap segments. My colleague Amy Arnott published research linking higher dispersion to better results for stock-pickers, but cautioned against dramatic conclusions in support of active management.
A more compelling implication, in my view, concerns sector returns. Recent years have seen some dramatic sector rotations, which have contributed to higher dispersion. Much has been made about the “winner take all” or “winner take most” dynamic, both in the economy and the stock market.
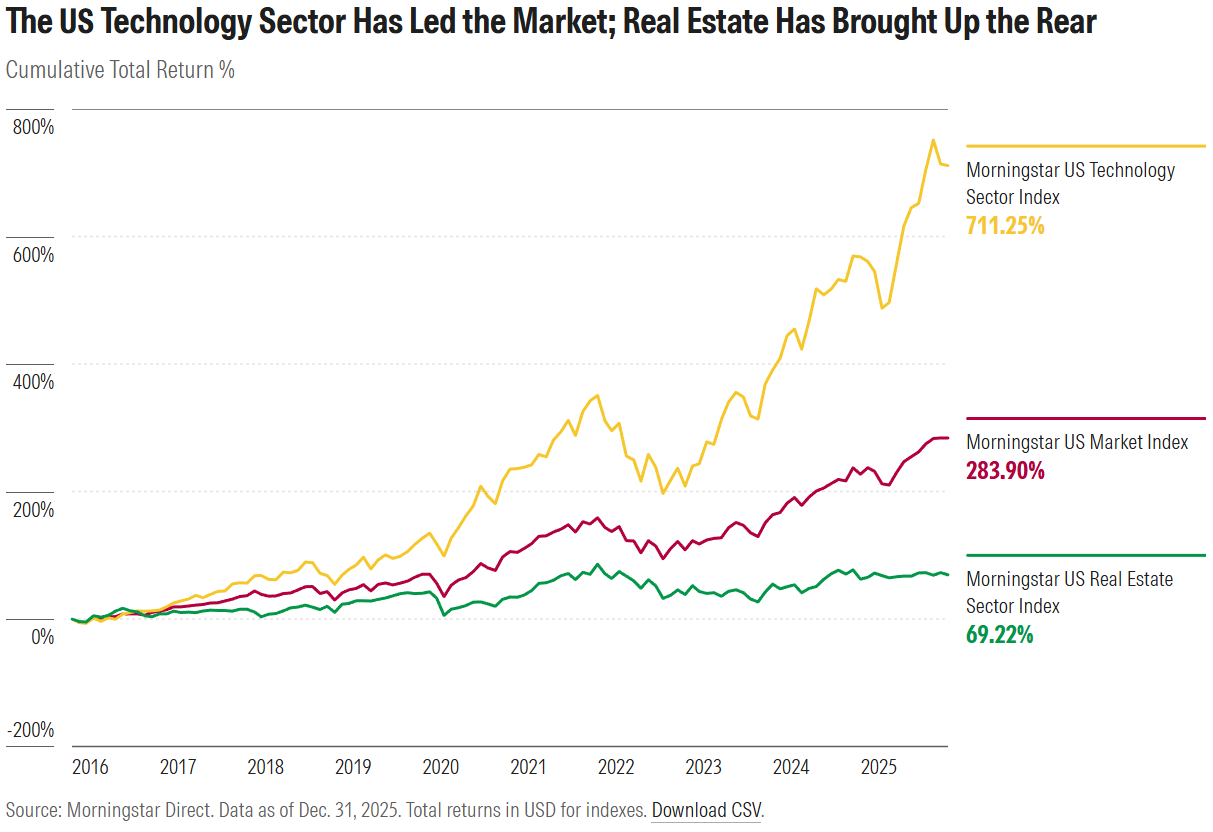
Morningstar’s Jeff Ptak recently looked at the cyclicality of sector leadership in US equities. He showed that “the top-performing sector of the past decade routinely lags over the subsequent 10 years.” This record makes him bearish on the technology sector, which has logged the highest return by far of any sector of the US stock market since 2016. Real estate, for the record, is the worst performer.
A key caveat to this whole discussion is that it traffics in historical data. As we’ve all heard a thousand times, the past is not predictive. Narula observes that while dispersion levels have tended to persist for some time, crises, often unforeseen and with distinct triggers, can change the picture.
As always, it’s better to prepare than predict. Diversification across different types of stocks increases the odds that investors will have exposure to at least some winners in their portfolio. Here are some practical tips on how to diversify in 2026.
©2026 Morningstar. All Rights Reserved. The information, data, analyses and opinions contained herein (1) include the proprietary information of Morningstar, (2) may not be copied or redistributed, (3) do not constitute investment advice offered by Morningstar, (4) are provided solely for informational purposes and therefore are not an offer to buy or sell a security, and (5) are not warranted to be correct, complete or accurate. Morningstar has not given its consent to be deemed an "expert" under the federal Securities Act of 1933. Except as otherwise required by law, Morningstar is not responsible for any trading decisions, damages or other losses resulting from, or related to, this information, data, analyses or opinions or their use. References to specific securities or other investment options should not be considered an offer (as defined by the Securities and Exchange Act) to purchase or sell that specific investment. Past performance does not guarantee future results. Before making any investment decision, consider if the investment is suitable for you by referencing your own financial position, investment objectives, and risk profile. Always consult with your financial advisor before investing.
Indexes are unmanaged and not available for direct investment.
Morningstar indexes are created and maintained by Morningstar, Inc. Morningstar® is a registered trademark of Morningstar, Inc.