Here’s a trivia question for you: What do 3M MMM, Walgreens WBA, Intel INTC, Harley-Davidson HOG, and Shell SHEL have in common? Answer: All are companies that have cut their dividends since 2020. Despite being household names—some even considered blue-chip stocks with long dividend-paying histories—each suspended, eliminated, or reduced payouts to shareholders. The cause: financial distress.
You hear a lot about “dividend growth.” Companies raising their payouts signal balance-sheet strength and an improving position. The concept is so appealing that there are 68 funds and exchange-traded funds in Morningstar’s database with “dividend growth” in their name, holding a collective $158 billion in investor capital.
You don’t hear nearly as much about dividend reductions, but they are a real risk for investors. It’s not just about diminished income. Dividend cuts, typically a sign of fundamental trouble, are often accompanied by share price declines. So, investors experience a double whammy of declining income and principal. The good news? There are ways to predict dividend cuts. None is foolproof, but they tilt the odds in dividend stock investors’ favor.
Walgreens’ Dividend Cut: The Tale of a Classic Dividend Trap
Like many of you, I’ve long shopped at Walgreens for pharmaceuticals and other household items. “Nearly three quarters of Americans live within five miles of a Walgreens location,” according to the company profile on Morningstar.com. Investors and those of us with friends and family who work at the company’s Chicago-area headquarters might also be aware that the business has globalized. The Walgreens Boots Alliance WBA name reflects the acquisition of a British pharmacy chain; it has also snapped up businesses like VillageMD and Summit Health.
The acquisitions have failed to boost the business. “The retail environment is intensely competitive,” writes Morningstar equity analyst Keonhee Kim. The company has faced reimbursement pricing pressure from pharmacy benefit managers, tough conditions for brick-and-mortar stores, and integration challenges.
As the business struggled, Walgreens’ share price came under pressure. It declined more than the broad US equity market during the selloff of 2022. Then, in 2023, it fell 25%, adrift in a market obsessed with artificial intelligence.
For income investors, though, there was reason to pay attention to Walgreens at the end of 2023. Thanks to the falling share price, the stock’s dividend yield hovered around 9%. What’s more, the company had a near 50-year history of paying out dividends to shareholders coming into 2024. The stock ticked a lot of boxes for income seekers. It was even referred to as a “dividend aristocrat.”
As has happened to many historical aristocracies, though, Walgreens suffered a humiliating fall. In January 2024, it slashed its dividend. Facing declining earnings and negative free cash flow, Walgreens announced a reduction of its quarterly payout from $0.48 per share to $0.25.
Though necessary, the dividend cut did not alleviate financial problems. Nor did it improve investor perception. Walgreens Boots Alliance’s share price fell a total of 60% in 2024. In March 2025 came an announcement that the business would be acquired by Sycamore Partners, a private equity firm.
What’s the moral of this story? First, lofty dividend yields can be a sign of fundamental trouble. Remember, one way for yield to rise is for the share price to drop. Second, dividend history will only get you so far. The past isn’t predictive. That’s not only true for Walgreens of the companies mentioned above. 3M had paid out a dividend for 67 years when it cut in May 2024. Shell is an even more dramatic example; it had a history of dividend payments stretching back to World War II before a pandemic-driven oil price collapse forced a cut in 2020.
“Dividend traps” are stocks that lure investors with the promise of a substantial payout that ends up as unsustainable. Some dividend yields are too good to be true. Rather than relying on current income and dividend track record, equity income investors are better off looking forward.
I’ll briefly share three screens employed by Morningstar Indexes for dividend stock benchmarks. None is foolproof, but they improve the odds of avoiding dividend cuts. My colleague Saumya Gattani has crunched the numbers, and we’ll share the results below.
Dividend Cut Predictor 1: The Payout Ratio
The payout ratio measures the percentage of a company’s earnings that it pays out in dividends. For many equity income investors, there’s a happy medium, where the company is generously returning cash back to shareholders, but with a cushion. Indeed, we’ve found that over the past 20 years, companies with high payout ratios were most likely to cut their dividends.
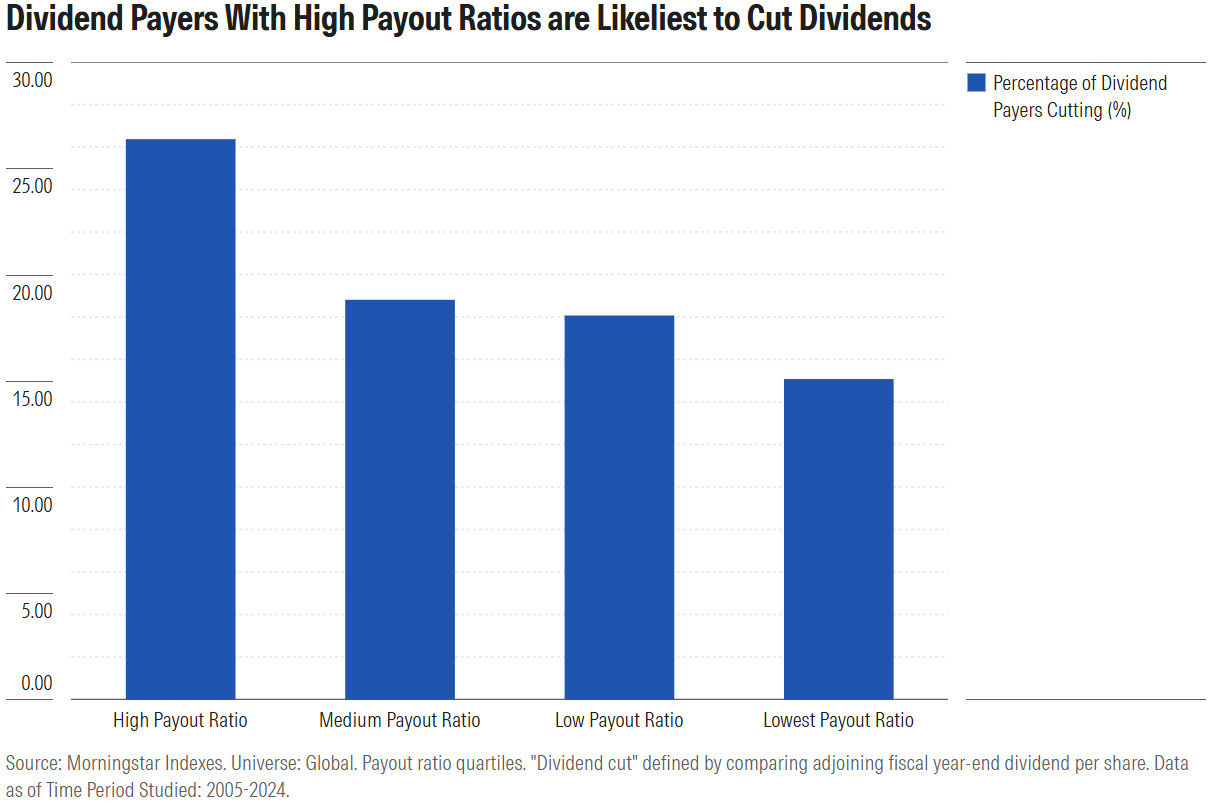
Walgreens’ payout ratio before its dividend cut was certainly a red flag. According to data appearing on the Dividends tab of Walgreens Boots Alliance’s stock page on Morningstar.com, its payout ratio at the end of 2023 was a shocking 290.91%. That means it was paying out nearly 3 times more in dividends than it earned that year. Unsustainable, to say the least.
Dividend Cut Predictor 2: Economic Moat
Morningstar’s Equity Research Team defines an economic moat as a durable competitive advantage that protects a company from competition. Wide moat companies should be able to sustain profitability better than narrow moat companies, and both are better positioned than no moat companies. According to Saumya’s research, moats also defend dividends. Over the past 20 years, companies with wide moats cut dividends less frequently and no-moat companies dividends most frequently.
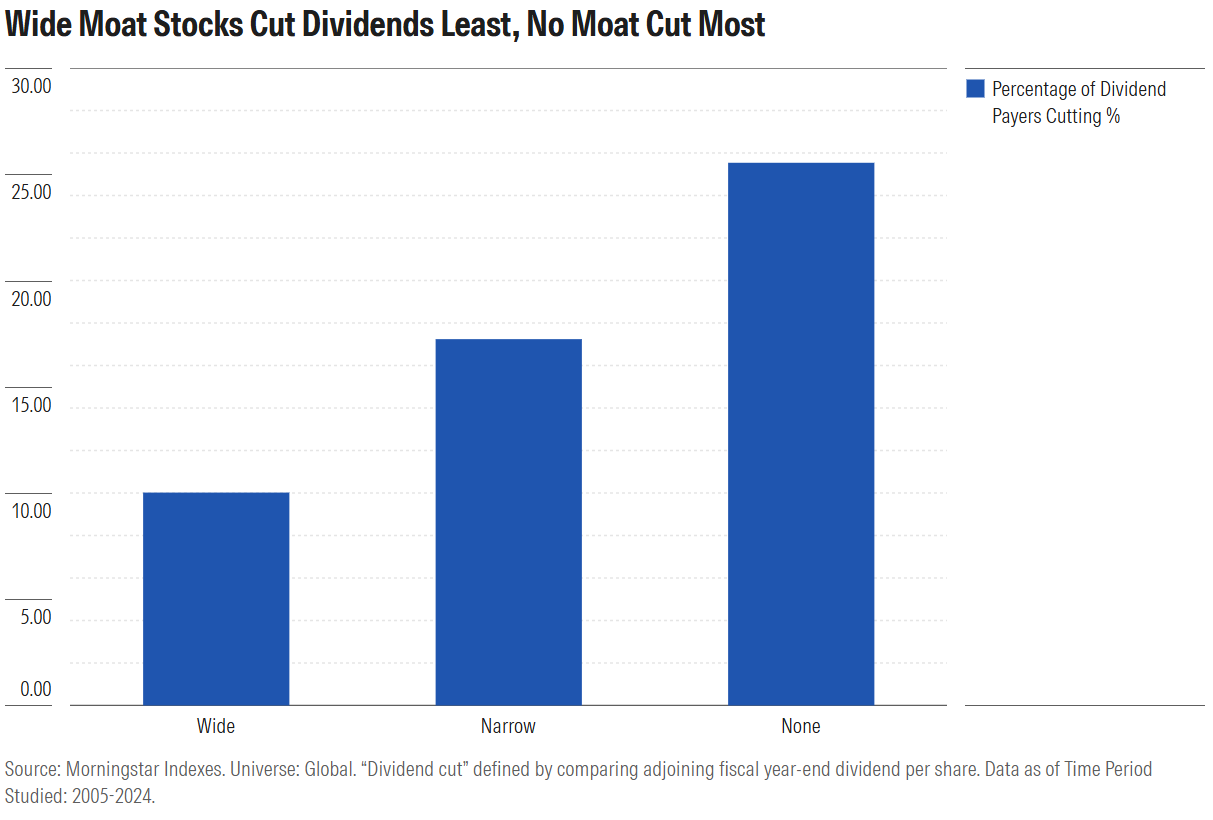
Walgreens is a no-moat business. According to its Morningstar current report: “[W]e do not believe the company possesses any structural advantages strong enough to earn excess returns and generate returns on invested capital above its cost of capital over the next 10 years.” Unable to sustain profits in a competitive retail environment, Walgreens cut its dividend.
Dividend Cut Predictor 3: Distance to Default
Morningstar Indexes uses Distance to Default to measure financial health. A quantitative metric, it gauges the risk that the value of a company’s assets will turn out to be less than the sum of its liabilities. Distance to Default considers equity value and share-price volatility on the idea that the market sometimes sniffs out weakness before it shows up in balance sheet numbers. Sure enough, the measure is predictive of dividend sustainability. Saumya found that the better a company’s Distance to Default score relative to sector peers, the likelier it is to sustain its payout.
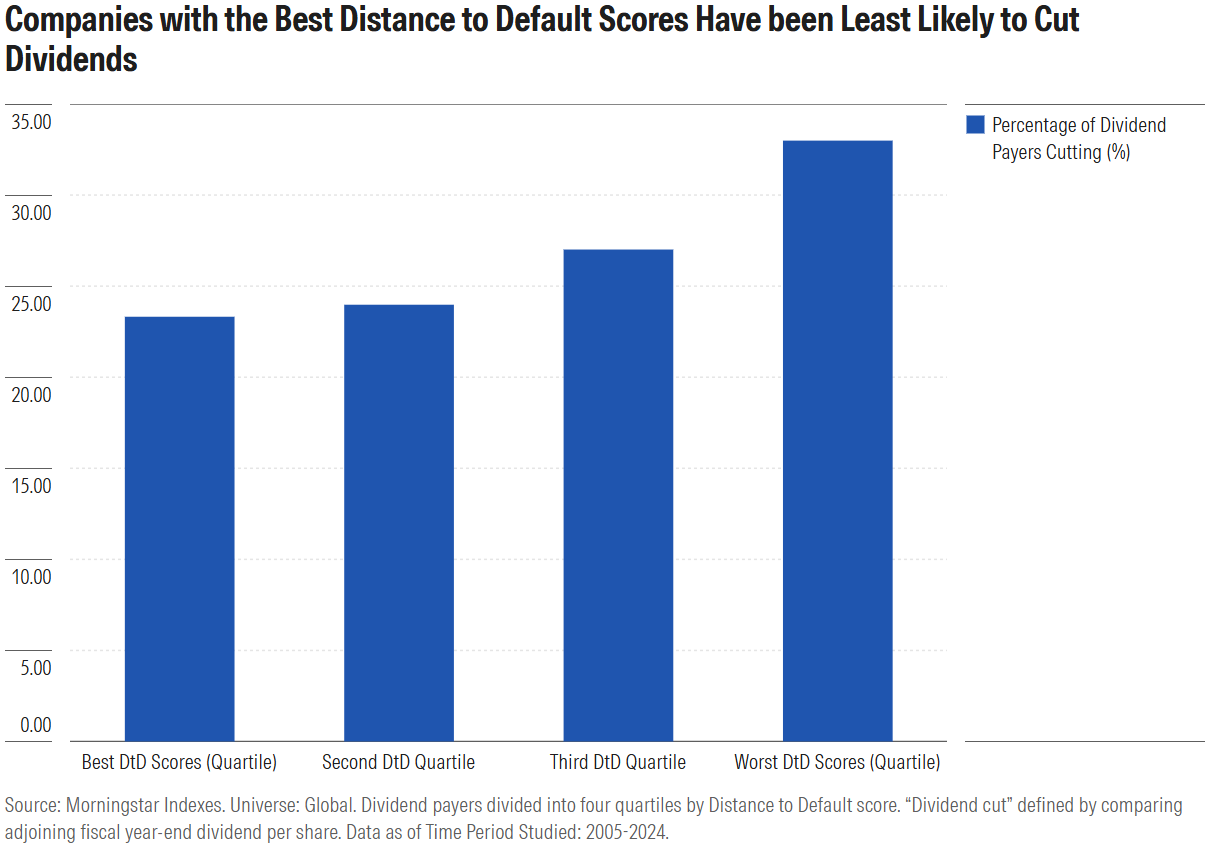
You guessed it, Walgreens scored poorly on the Distance to Default measure before its dividend cut. Faced with deteriorating financial health, including a plummeting share price, the company slashed its payout to shareholders. Distance to Default is not available as a data point on Morningstar.com, though it is used as a screen in dividend benchmarks such as the Morningstar Dividend Yield Focus Index.
The Bottom Line: Successful Dividend Stock Investing Doesn’t Neglect Total Return
Tempting as they might be, the stock market’s juiciest yields are often illusory. High dividend yields are often found in risky sectors, industries, and companies. As discussed, some payouts are unsustainable. When a dividend is cut, investors typically experience a decline in both income and principal. Pursuing income at all costs—and at the expense of total return—leads to bad outcomes.
Although dividend stocks as a group lagged in recent years, they remain a perfectly reasonable way to participate in the stock market. Investment leadership is cyclical. The dividend-light tech stocks that have paced the market may eventually cede leadership. Over the very long term, dividend stocks have performed well; they tend to be more solid, financially secure, and sensibly managed than average. The future for dividend stocks may be brighter than the recent past. Just beware of dividend traps.
©2025 Morningstar. All Rights Reserved. The information, data, analyses and opinions contained herein (1) include the proprietary information of Morningstar, (2) may not be copied or redistributed, (3) do not constitute investment advice offered by Morningstar, (4) are provided solely for informational purposes and therefore are not an offer to buy or sell a security, and (5) are not warranted to be correct, complete or accurate. Morningstar has not given its consent to be deemed an "expert" under the federal Securities Act of 1933. Except as otherwise required by law, Morningstar is not responsible for any trading decisions, damages or other losses resulting from, or related to, this information, data, analyses or opinions or their use. References to specific securities or other investment options should not be considered an offer (as defined by the Securities and Exchange Act) to purchase or sell that specific investment. Past performance does not guarantee future results. Before making any investment decision, consider if the investment is suitable for you by referencing your own financial position, investment objectives, and risk profile. Always consult with your financial advisor before investing.
Indexes are unmanaged and not available for direct investment.
Morningstar indexes are created and maintained by Morningstar, Inc. Morningstar® is a registered trademark of Morningstar, Inc.