Why aren’t wide-moat stocks holding up better this year? It’s a question that trended heavily in the first quarter of 2026, when the broad US stock market declined by more than 4% and many high-quality, competitively advantaged companies, as defined by the Morningstar Economic Moat Rating, fell even further.
You’d think that when equities sell off, wide-moat stocks would benefit from a flight to quality. Given their underperformance in 2026, it’s fair to ask: Do wide-moat stocks actually help investors play defense?
Measuring Performance by Moat
To examine the behavior of stocks by moat rating, I looked at three Morningstar moat composite indexes. We have indexes for each of the three moat levels: wide, narrow, and none. The versions I’ll use include only US-rated stocks and equally weight their constituents. This way, we neutralize the impact of huge companies like Nvidia NVDA and Apple AAPL and isolate the moat ratings’ influence on returns.
As of March 31, 2026, the Morningstar Wide Moat Composite Equal Weighted Index contained 171 stocks, the Morningstar Narrow Moat Equal Weighted Index included 278 stocks, and the Morningstar No Moat Equal Weighted Index numbered 180. Note that this breakdown shouldn’t be interpreted to mean that most companies possess competitive advantages. Morningstar equity analyst coverage skews toward companies with moats.
The numbers show that US wide-moat stocks performed the worst in the first quarter of 2026.
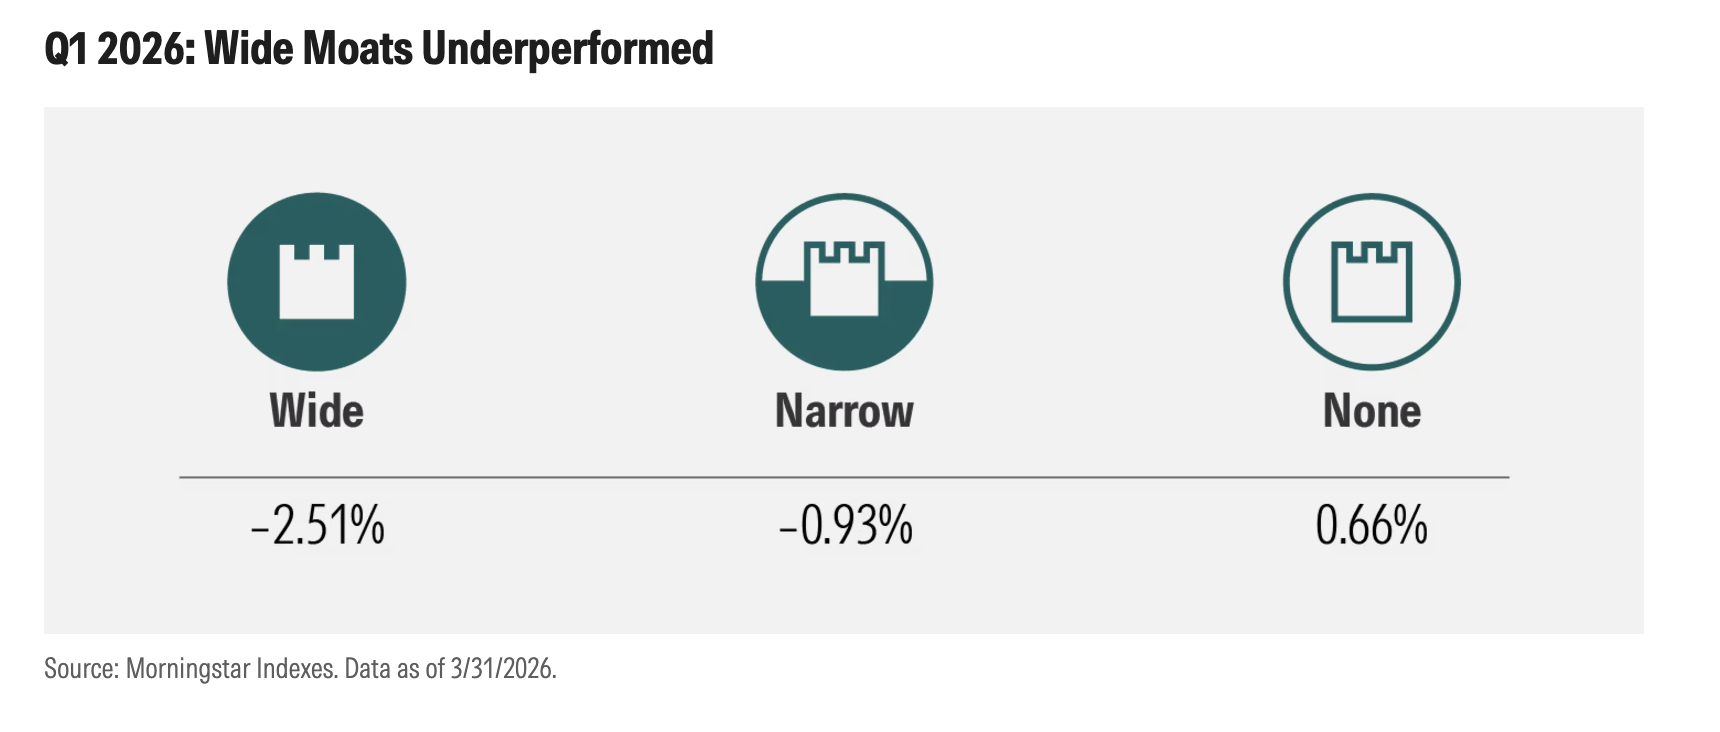
The fact that all three of these indexes outperformed the overall market in the first quarter is a function of their equal-weighted nature. Some of the largest public companies, including Microsoft MSFT, Meta Platforms META, and Tesla TSLA, suffered double-digit share price declines over the quarter, dragging down the overall market. For this exercise, direction matters more than magnitude.
When I run attribution analysis on the Morningstar Wide Moat Composite Equal Weighted Index for the first quarter, I see the technology sector, lots of software stocks in particular, detracting from returns. Several companies that carried wide moat ratings in the first quarter, including Salesforce CRM, ServiceNow NOW, and Adobe ADBE, got caught up in the software selloff sparked by fears of artificial intelligence disruption. Other wide-moat data-oriented businesses outside the technology sector were also hit hard, including CoStar Group CSGP (real estate). Some wide-moat consumer defensives, such as Estee Lauder EL, also detracted in the first quarter.
As for the narrow-moat and no-moat indexes, both were boosted by the energy sector. The outbreak of war in the Middle East sent oil prices soaring, benefiting narrow-moat stocks like ExxonMobil XOM and no-moat businesses such as Occidental Petroleum OXY. Rising prices for other commodities helped several narrow-moat basic materials companies, including Dow DOW and Corning GLW.
It’s also worth mentioning a pocket of the technology sector home to many no-moat businesses that performed exceptionally well in the first quarter. AI-driven demand has boosted memory-related businesses. Winners included Sandisk SNDK, Western Digital WDC, and Seagate Technology STX, despite operating in what Morningstar equity analysts view as a commodity business.
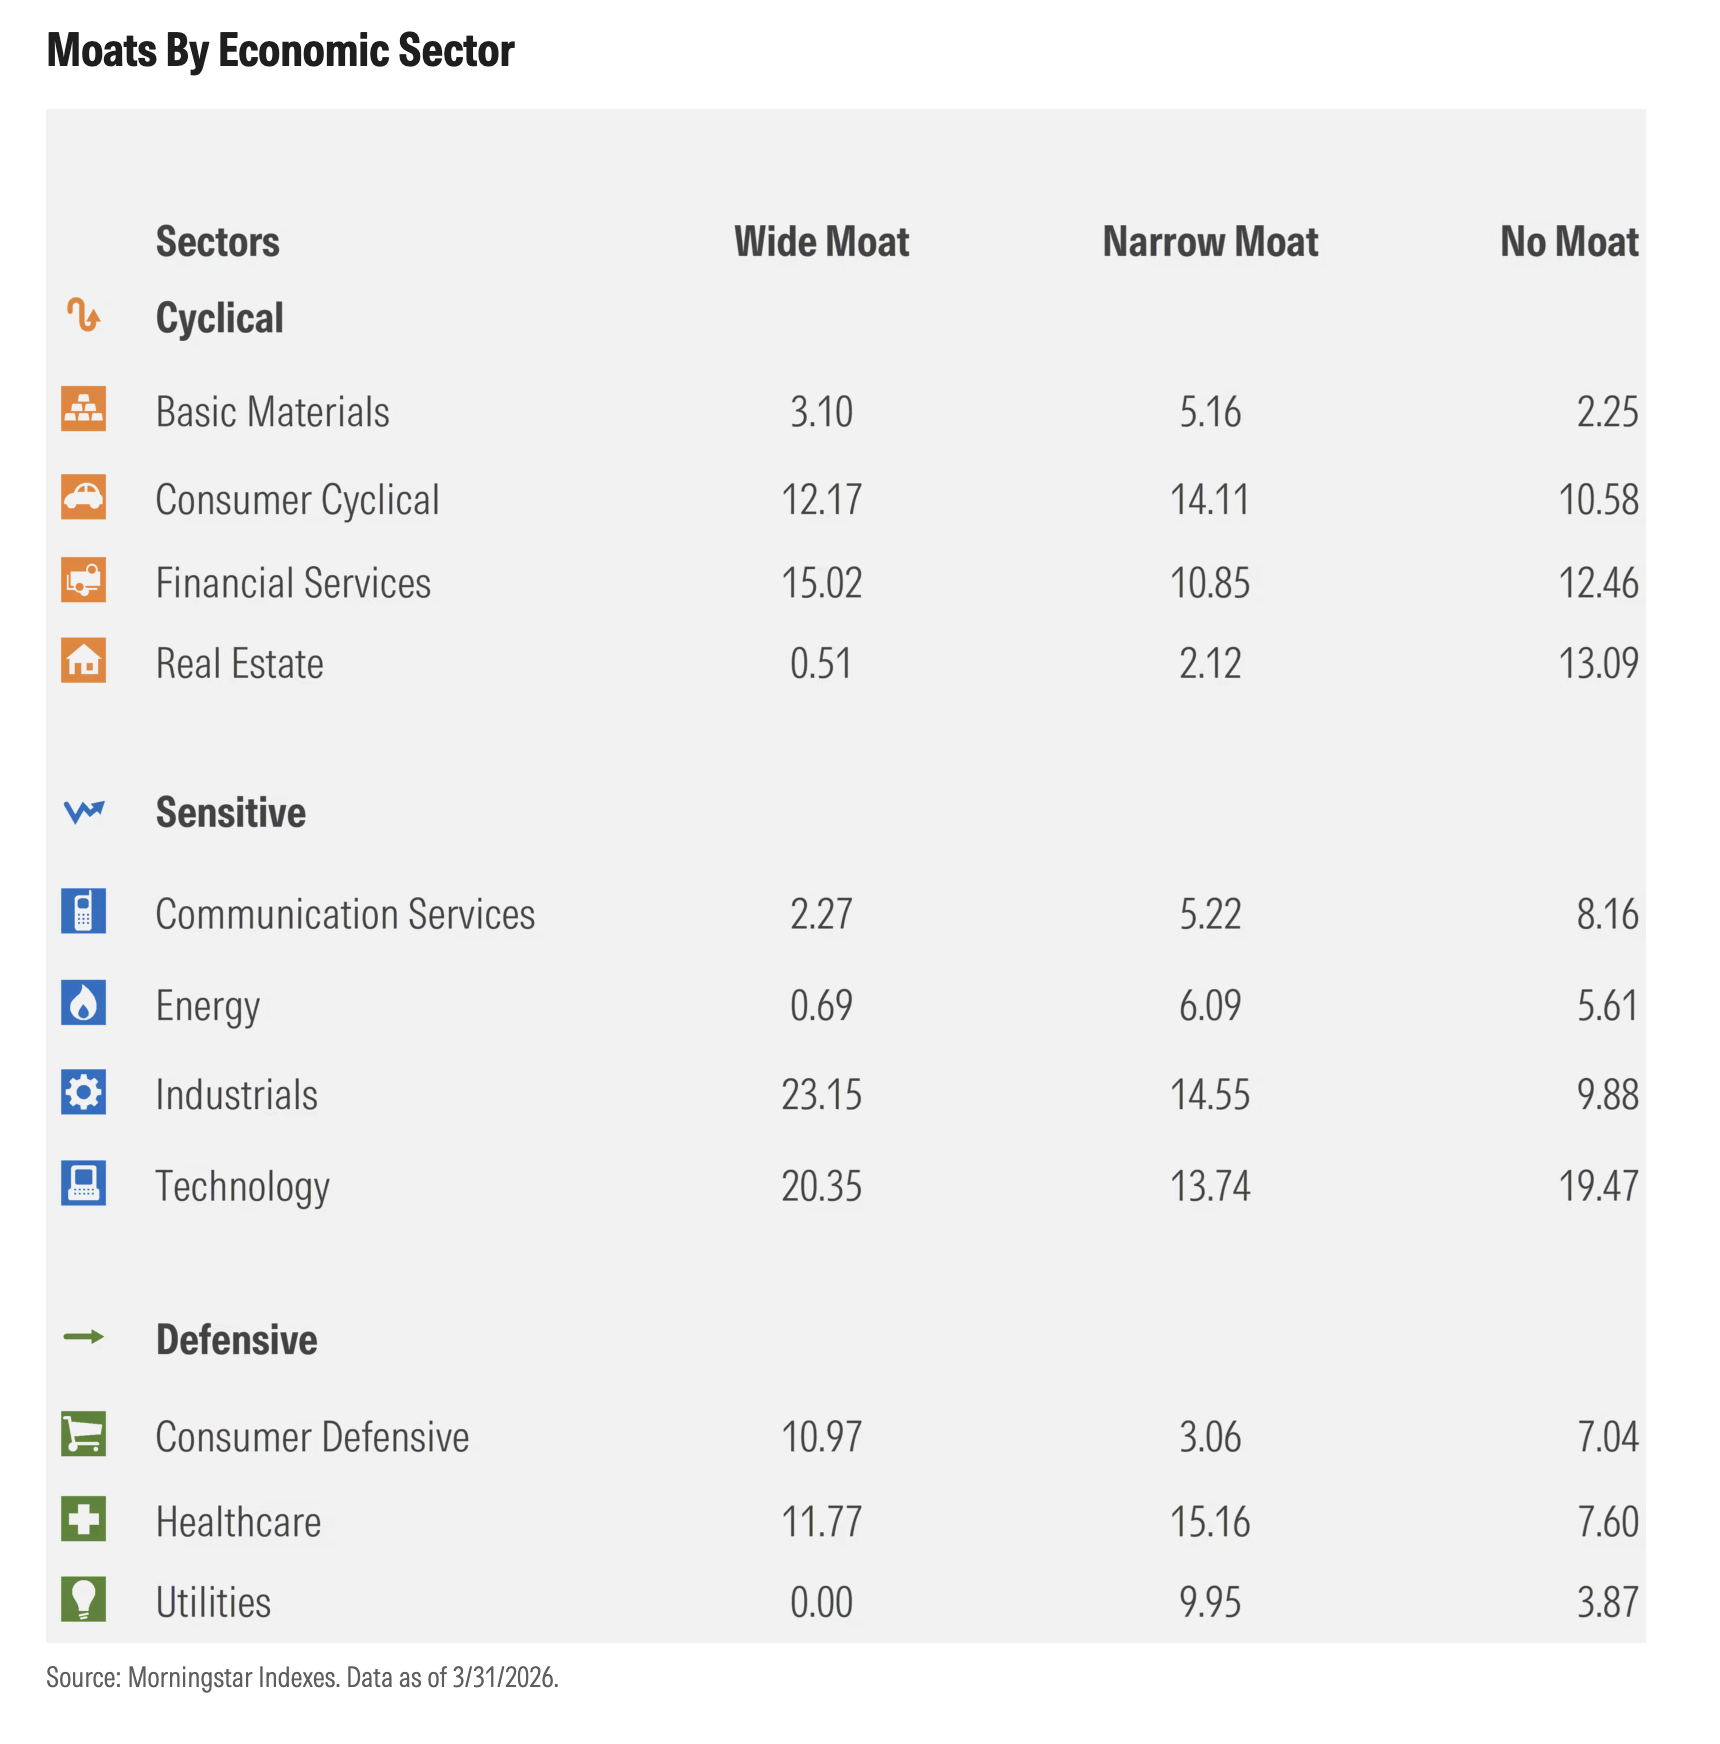
With all this talk of economic sectors, it’s worth examining the moat composite indexes’ sector composition. As seen below, technology stocks vary by moat rating. The same is true of consumer defensives. The industrials sector is heavy on moats, while real estate is largely a no-moat business. Healthcare and utilities are filled with narrow-moat stocks.
Have Wide-Moat Stocks Held Up During Other Down Periods?
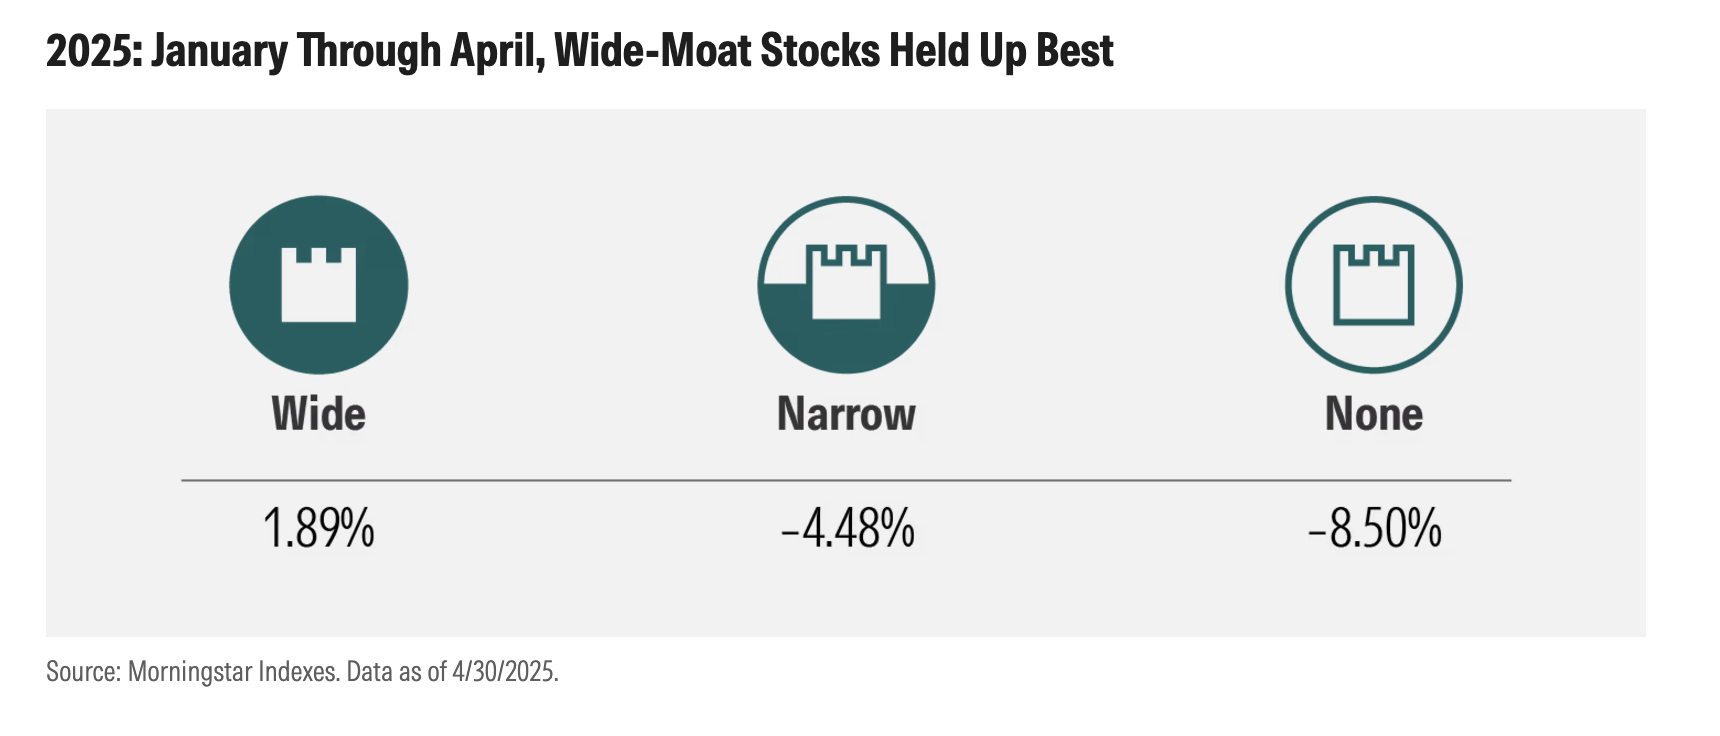
So, we’ve established that wide-moat stocks performed poorly as a group in the first quarter of 2026. What about other difficult periods for the US stock market? Let’s look at the first four months of 2025. I’d normally stick to calendar quarters, but April 2025 was an exceptionally brutal month, as President Donald Trump’s tariff announcements sank stocks.
During that downturn, wide-moat stocks held up best. No-moat stocks lost the most.
Attribution analysis for that period reveals that the sector orientation of the wide-moat universe was actually a disadvantage. The relative resilience of the wide-moat index during that period owed to the performance of individual companies, like VeriSign VRSN, Philip Morris PM, and GE Aerospace GE.
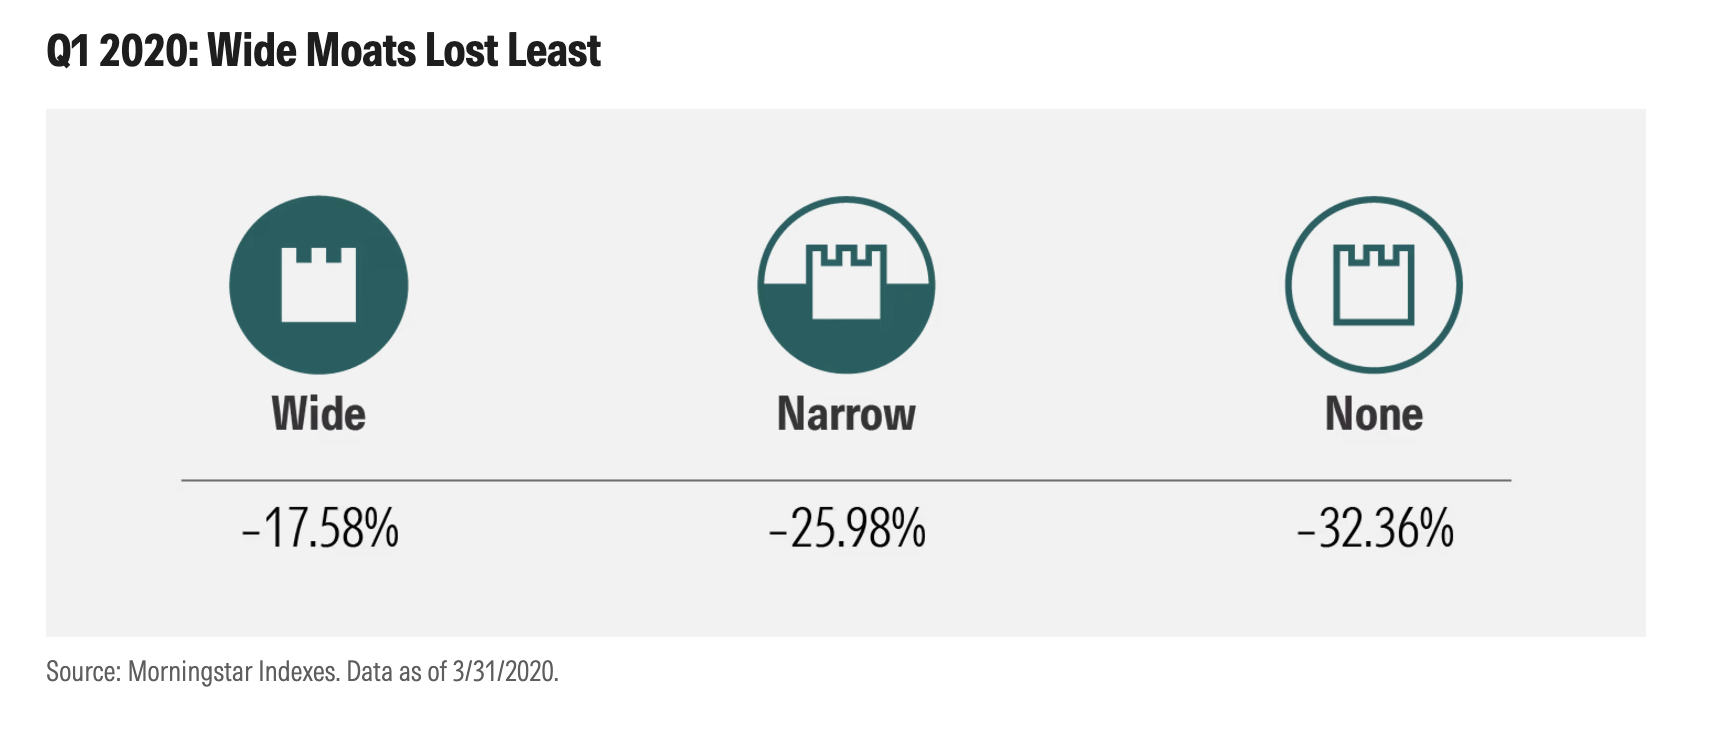
Let’s look at a sharper selloff—the “pandemic panic” of 2020’s first quarter. Societal lockdowns wreaked havoc across the market. Again, wide-moat stocks held up best, and no-moat stocks fell furthest.
During that time frame, both sector biases and stock-specific effects help explain the relative resilience of wide-moat stocks. Defensive areas of the stock market, like healthcare and consumer staples, that are plentiful in the wide-moat index held up better than more economically sensitive sectors. Wide-moat stocks Clorox CLX, Veeva Systems VEEV, and Gilead Sciences GILD actually rose that quarter, while no-moat stocks Delta Air Lines DAL and GM GM plunged.
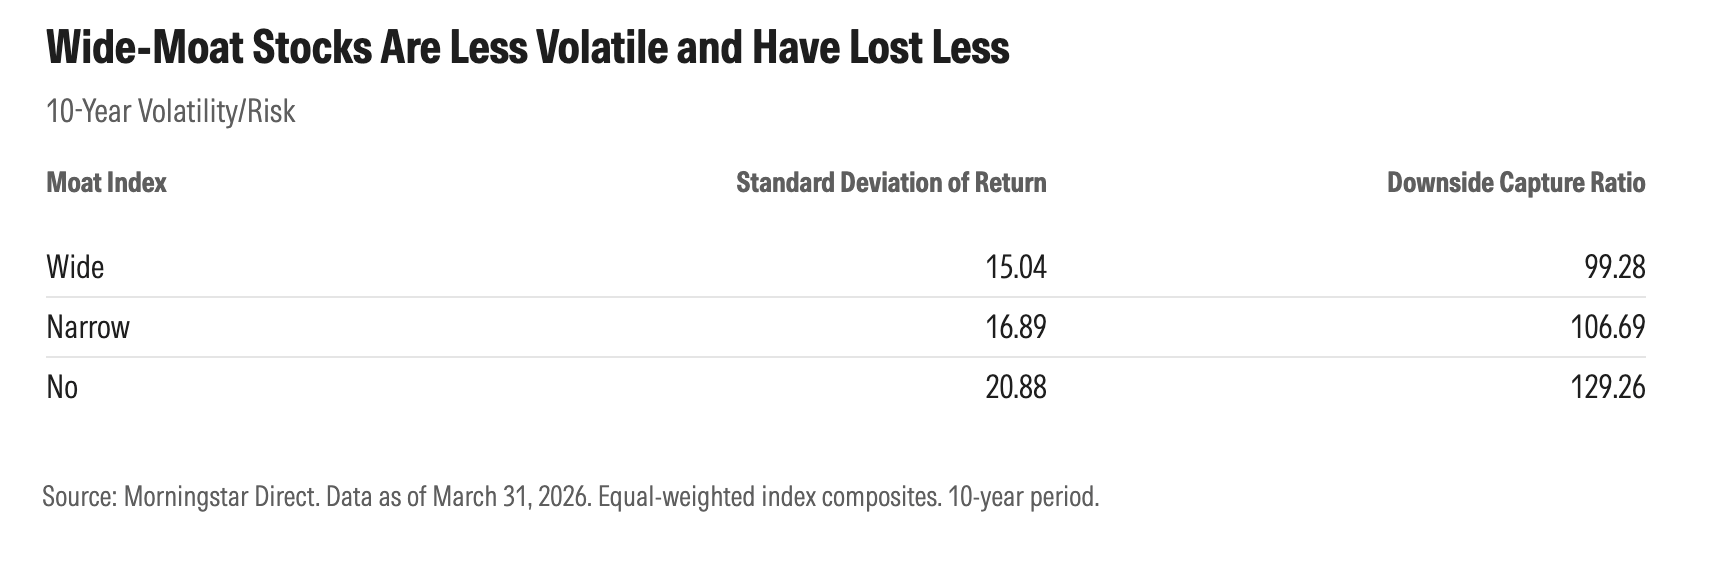
For some readers, the analysis thus far will feel too anecdotal. They’ll want to know how the moat indexes compare on more traditional measures of investment risk. Fair enough. Over the past 10 years, a period including both bull and bear markets, here’s how the moat indexes shake out in terms of standard deviation of returns (a measure of volatility) as well as downside capture ratio. Again, pay more attention to direction than magnitude, as these statistics are for equal-weighted indexes. According to the exhibit below, wide-moat stocks have been less volatile, and no-moat stocks the most volatile. The wide-moat index consistently held up best during down markets.
Remember, Moats Are Changeable
Today’s wide-moat companies may not be tomorrow’s. Although Morningstar’s economic moat framework is forward-looking, our equity research team constantly monitors its moat ratings and adjusts when needed. Historically, certain market disruptions have triggered broadscale, ad hoc reviews, including during the 2007-09 global financial crisis, the 2014-15 collapse of oil and gas prices, and the 2020 covid-19 pandemic.
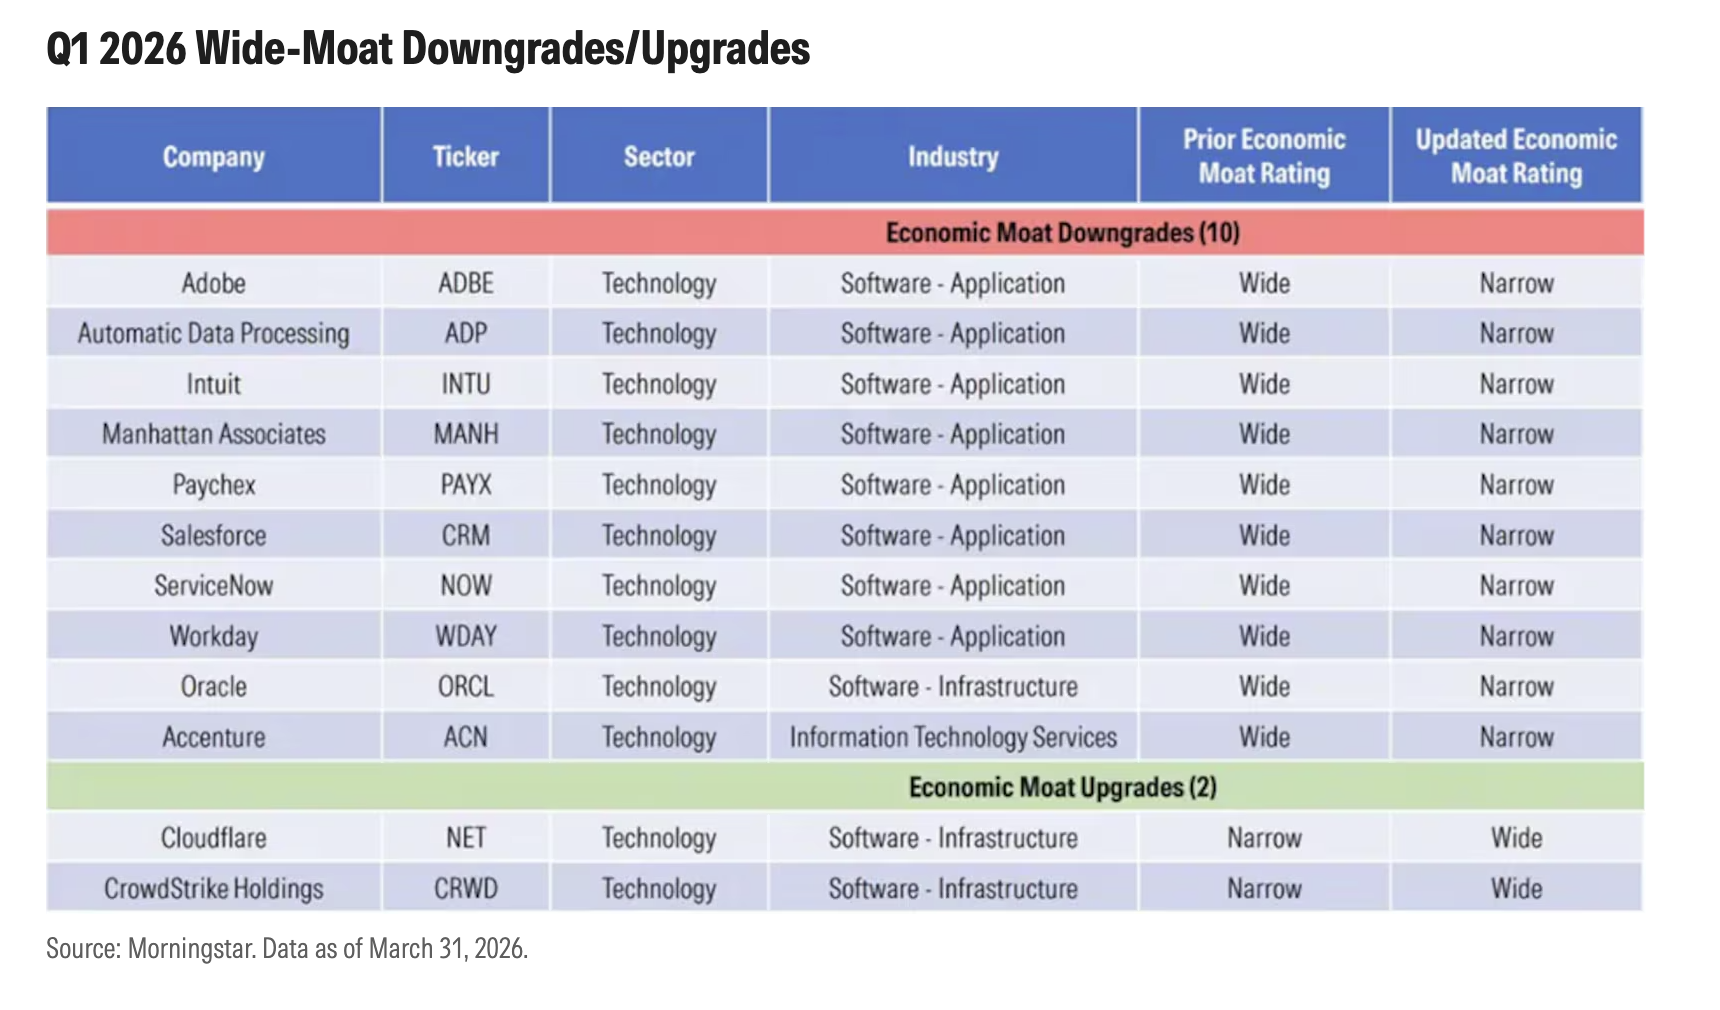
Another broadscale review occurred in the first quarter of 2026 in response to AI-driven market dislocation. The team concluded that AI is not a universal disruptor of all competitive advantages but will function as a sorting mechanism. Several wide-moat companies saw their moat ratings downgraded, and a few were upgraded.
Economic Moats, Though Resilient, Are Insufficient on Their Own
The first quarter of 2026 showed that wide-moat stocks don’t always hold up best. Every market selloff is different. That said, moats have helped investors play defense in several historical downturns. Over the long term, high-quality, competitively advantaged businesses have exhibited lower volatility, as you’d expect.
Moats on their own shouldn’t be the basis for investment decisions. Morningstar Equity Research believes investors should also consider valuation. For the best outcomes, it’s advisable to buy wide-moat companies when they are trading at discounts to Morningstar equity analysts’ estimates of intrinsic value. Even wide-moat stocks won’t be great investments if they are trading at lofty prices.
©2026 Morningstar. All Rights Reserved. The information, data, analyses and opinions contained herein (1) include the proprietary information of Morningstar, (2) may not be copied or redistributed, (3) do not constitute investment advice offered by Morningstar, (4) are provided solely for informational purposes and therefore are not an offer to buy or sell a security, and (5) are not warranted to be correct, complete or accurate. Morningstar has not given its consent to be deemed an "expert" under the federal Securities Act of 1933. Except as otherwise required by law, Morningstar is not responsible for any trading decisions, damages or other losses resulting from, or related to, this information, data, analyses or opinions or their use. References to specific securities or other investment options should not be considered an offer (as defined by the Securities and Exchange Act) to purchase or sell that specific investment. Past performance does not guarantee future results. Before making any investment decision, consider if the investment is suitable for you by referencing your own financial position, investment objectives, and risk profile. Always consult with your financial advisor before investing.
Indexes are unmanaged and not available for direct investment.
Morningstar indexes are created and maintained by Morningstar, Inc. Morningstar® is a registered trademark of Morningstar, Inc.