As originally published on Morningstar.com.
Market volatility tests the resilience of investment strategies. Curious about how the volatility triggered by President Donald Trump’s on-again/off-again tariff policy affected the performance of sustainable investment strategies, and mindful that Earth Day 2025 was approaching, we looked at how diversified sustainability benchmarks performed in relation to the underlying markets and considered the short- and long-term implications for sustainable investors.
Morningstar subscribes to the principle of investing for the long term, though short-term performance in volatile markets may reveal characteristics of interest to investors. For a long-term perspective on sustainability index performance, see this report.
The analysis compares the Morningstar Global Markets Sustainability Index family to the broad market-cap-weighted Morningstar Global Markets Index family. The Morningstar Global Markets Sustainability Index is designed to reduce exposure to environmental, social, and governance risk by targeting stocks with low Morningstar Sustainalytics ESG Risk Ratings, representing 50% of the Morningstar Global Markets Large-Mid Cap Index by free-float market cap. The indexes are constructed using ESG Risk Ratings.
We analyzed year-to-date performance for the global, US, and Europe markets for the period from Jan. 1 to April 11, 2025. This period encompasses all-time highs for most broad US benchmarks, including the Morningstar US Sustainability Index, which peaked on Feb. 18. The market trended down after the peak, driven by signs of a weakening economy and concerns about announced tariffs on Canada and Mexico, before comprehensive global tariffs triggered a global selloff two weeks later on April 2.
US and Global Sustainable Indexes Outperform, Europe Lags
Since peaking in early 2025, the US equity market has been hit harder by the volatility induced by Trump’s tariffs than either Europe—which has positive performance—or the global markets. In terms of relative performance, Morningstar’s US Sustainability and Global Markets Sustainability indexes outperformed their broad market counterparts, while the Morningstar Europe Sustainability Index lagged the Morningstar Europe Index despite its positive performance. It’s worth noting that short-term performance is more susceptible to influence by idiosyncratic factors than longer periods, where systematic factors are more pronounced.
We evaluate performance from three angles:
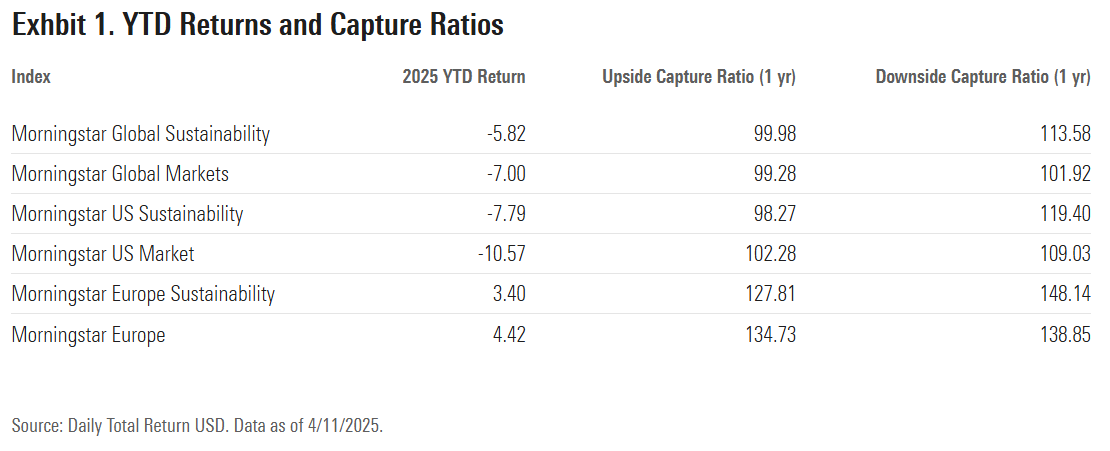
- Year-to-date total returns in US dollars.
- Year-to-date performance attribution analysis, showing which sectors had the greatest impact on the performance of the sustainability indexes.
- One-year upside- and downside-capture ratios showing relative benchmark performance in up markets and down markets for the year ending March 31, 2025. This period exhibited a higher standard deviation of values than longer periods. (A downside-capture ratio greater than the market benchmark means the index lost more than the benchmark when the market is down. Likewise, an upside-capture ratio greater than the market benchmark means the index outperformed the market benchmark in up markets.)
How Global Markets Performed
- The Morningstar Global Markets Sustainability Index was down 4.54%, while the Morningstar Global Markets Index was down 5.69%, so the sustainability benchmark outperformed the broad market by 1.15%.
- Performance attribution reveals that the communication services (0.24%) and utilities (0.20%) sectors provided the largest positive contribution, and technology (-3.55%) provided the largest negative contribution to the global sustainability index’s performance.
- Capture analysis shows that the Morningstar Global Markets Sustainability Index performed the same on the upside and underperformed on the downside compared with the Morningstar Global Markets Index.
How the US Market Performed
- The Morningstar US Sustainability Index was down 6.20%, while the Morningstar US Market Index was down 8.96%, so the sustainability benchmark outperformed the broad market by 2.76%.
- Performance attribution reveals that the communication services (0.06%) and utilities (0.01%) sectors provided the largest positive contribution, and technology (-4.02%) provided the largest negative contribution to the US sustainability index’s performance.
- Capture analysis shows that the Morningstar US Sustainability Index underperformed on the upside and downside compared with the Morningstar US Market Index.
How European Markets Performed
- The Morningstar Europe Sustainability Index was up 4.64%, while the Morningstar Europe Index was up 5.81%, so the broad market index outperformed the sustainability index by 1.17%.
- Performance attribution reveals that the financial-services sector (3.41%) provided the largest positive contribution, and the consumer cyclical (-0.41%) and technology (-0.24%) sectors provided the largest negative contribution to the Europe sustainability index’s performance.
- Capture analysis shows that the sustainability index lagged on the upside and downside compared with the Morningstar Europe Index.
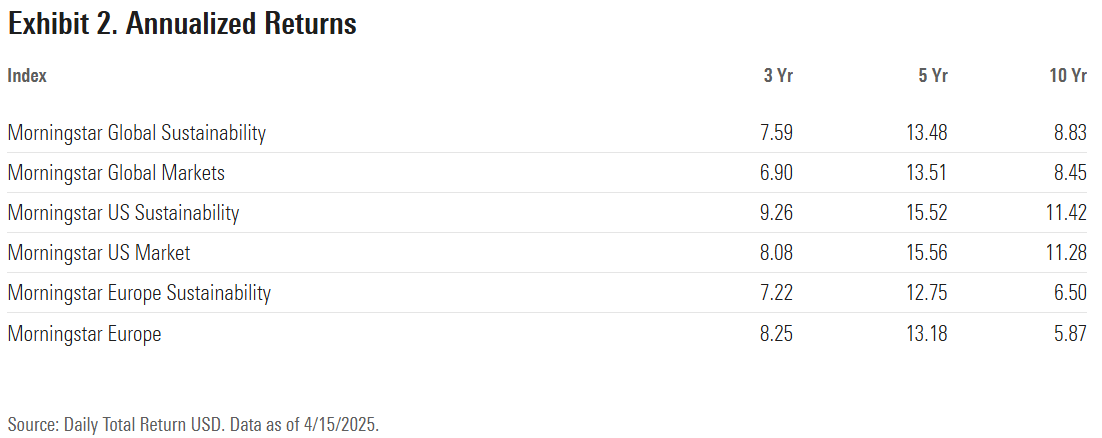
In the Longer Term, the US and Global Sustainability Indexes Have Beaten Their Conventional Counterparts
An examination of annualized performance over longer periods provides perspective on how Morningstar’s sustainability indexes perform in relation to their underlying markets.
- The Morningstar Sustainable index outperformed its parent index over one-, three-, and 10-year periods, and was virtually even over five years.
- The Morningstar US sustainable index outperformed its parent index over three- and 10-year periods, while underperforming over a one-year period and being virtually even over five years.
- The Morningstar Europe sustainable index lagged its parent index over one-, three-, and five-year periods, and outperformed over 10 years.
These benchmarks are designed to be diversified like the broad market while providing exposure to companies in each sector with lower ESG risk. Since they hold about 50% of the market capitalization in the parent index, they have more stock-specific (or idiosyncratic) risk. Consequently, it is not surprising that they generally perform in line with the market, outperforming in some periods and underperforming in others.
What Are the Implications for Sustainable Investors?
Sustainable investors are long-term investors, so it makes sense to look beyond current market dynamics. During the past two decades, they have forged strategies to help compensate for inconsistent or ineffective public policy to address negative externalities and systemic risks. These issues include climate change, which creates physical risk as its impact becomes more intense and transition risk as the economy moves away from carbon-based fuels, and growing inequality stemming from disparities in income and wealth distribution.
Current case in point: the Trump administration is loosening regulations on fossil fuels, blocking development of renewable energy and dismantling environmental protection regulations. US withdrawal from the Paris Accords and regression on climate-related initiatives undermine global efforts to reduce greenhouse gas emissions at a time when there is growing urgency to act.
Yet at the same time, market forces are already at work on the global energy transition, counterbalancing such efforts opposing sustainability initiatives. According to Ember’s Global Electricity Review 2025, in 2024 41% of global electricity generation came from low-carbon sources (including nuclear). That same year, solar generation grew 29%. PwC’s Second Annual State of Decarbonization Report documents that 84% of companies are maintaining their climate commitments, with 37% increasing their objectives and 16% pulling back. Some 83% are making R&D investments in low-carbon products and services. Deloitte’s 2024 CxO Sustainability Report shows that climate change is a top-three priority for companies, 85% of companies have increased their sustainability investments, and 70% expect that climate change will significantly affect their strategies and operations in the next three years.
If enacted, tariffs are expected to disrupt global trade and supply chains, creating uncertainty for corporate investment strategies and investor decision-making. They will also complicate the difficult task for companies of quantifying scope 3 greenhouse gas emissions associated with supply chain activity. This will set back global efforts to improve scope 3 reporting, which is essential for accurate emissions accounting.
Economists predict that the announced tariffs would slow US growth and generate inflation. At the same time, Europe is expected to experience higher growth as it invests more in defense in response to the US pullback from NATO. (See Morningstar’s Global Defense Sector Landscape report.) This development has caused European sustainable investors and regulators to rethink their stance on avoiding investment in weapons manufacturers.
For investors, there will always be a push and pull between reacting to short-term changes in markets and policy and sticking to longer-term macro trends and beliefs. The right approach is not always obvious and rarely black and white. This situation is no different for sustainable investors, and taking a deeper dive into the nuances of sustainable companies through our indexes can be instructive.
So while it is useful to evaluate how short-term market volatility affects sustainable investors, it’s also important to consider the longer-term ramifications of the causes and effects of these fluctuations. The Trump administration’s tariff policies, if enacted, will have negative repercussions for equity markets and investors. And even though its climate policies may hinder global efforts to mitigate climate change, investors can allocate assets to funds that address climate risk, seek climate solutions, and engage with companies to advance their decarbonization.
©2025 Morningstar. All Rights Reserved. The information, data, analyses and opinions contained herein (1) include the proprietary information of Morningstar, (2) may not be copied or redistributed, (3) do not constitute investment advice offered by Morningstar, (4) are provided solely for informational purposes and therefore are not an offer to buy or sell a security, and (5) are not warranted to be correct, complete or accurate. Morningstar has not given its consent to be deemed an "expert" under the federal Securities Act of 1933. Except as otherwise required by law, Morningstar is not responsible for any trading decisions, damages or other losses resulting from, or related to, this information, data, analyses or opinions or their use. References to specific securities or other investment options should not be considered an offer (as defined by the Securities and Exchange Act) to purchase or sell that specific investment. Past performance does not guarantee future results. Before making any investment decision, consider if the investment is suitable for you by referencing your own financial position, investment objectives, and risk profile. Always consult with your financial advisor before investing.
Indexes are unmanaged and not available for direct investment.
Morningstar indexes are created and maintained by Morningstar, Inc. Morningstar® is a registered trademark of Morningstar, Inc.